Data for researchers: Extracted text from FDA decision summaries for in vitro diagnostics
510(k)
datasets
de novo
FDA
medical devices
pma
R
regulatory science

Summary
The FDA publishes decision summaries for most of the in vitro diagnostics (IVDs) that it reviews through its 510(k), De Novo, and PMA premarket review programs. When the FDA reviews laboratory developed tests (LDTs) as IVDs, the FDA publishes decision summaries for these reviews as well. The FDA makes this information available in thousands of individual files on the FDA website. This information is of particular value because it is written by the FDA and represents the FDA’s approach to and conclusions about the technologies the FDA is reviewing. This post provides a consolidated dataset of extracted text from these decision summaries.
Introduction
Each year, the FDA authorizes around 500 in vitro diagnostics (IVDs) for use in the United States through the 510(k) program, the De Novo program, and the Premarket Approval (PMA) program.1 When the FDA authorizes an IVD, the FDA often publishes a “decision summary” or a “summary of safety and effectiveness data” (SSED) on its website, providing valuable insight into its decision-making.
The FDA posts decision summaries and SSEDs for most medical devices that come to the market through the De Novo and PMA programs, and, in addition, the FDA posts decision summaries for most IVDs that come to the market through the 510(k) program. For 510(k) devices that are not IVDs, the FDA usually only posts information written by device developers (not by the FDA), as described in this post.
The FDA makes this information available in thousands of individual files on the FDA website. This makes it possible to find information about the individual decisions the FDA has made. Using the information for other purposes, such as for gaining insight into how the IVD review program has changed over time or for pre-training Large Language Models (LLMs), has been more difficult.
That work may be easier going forward: Here, you’ll find a dataset with the full text contents of more than 7,000 IVD decision summaries and SSEDs. This includes full embedded and OCR text from over 81,000 pages. It can be downloaded in CSV format.
FDA Regulatory Expertise:
I help technology developers put their best foot forward when they need to interact with the FDA.
I help technology developers put their best foot forward when they need to interact with the FDA.
As with other datasets offered on this site, check back for updates around once per month, and if you use this dataset, please cite this page.
Dataset description
This dataset was assembled by downloading decision summaries and SSEDs for 510(k)s, De Novos, and PMAs associated with the following IVD review panels: Clinical Chemistry, Clinical Toxicology, Hematology, Immunology, Microbiology, Molecular Genetics, and Pathology. The dataset provides one row per page for each decision summary or SSED and includes the following fields:
submission_number- The 510(k), De Novo, or PMA number for the submission associated with the document.
file_description- An indication of whether a document is a “Decision Summary” or a “Summary of Safety and Effectiveness” based on the language used to describe the document on the FDA’s website.
date_obtained- The date the document was obtained from the FDA website. The date is formatted according to ISO 8601.
page_number- The PDF page index from which the text was obtained.
text_embedded- The contents of any text embedded in the PDF.
text_ocr- The contents of any text found using optical character recognition (OCR).
Download the data
NoteNo warranty
The information in this dataset is from sources in the public domain. It is provided here “as-is” without warranty of any kind. You may also want to refer to the FDA’s website.
The dataset is available as a gzip-compressed CSV file: ivd_decision_summary_text.csv.gz (Size: 58.9M, MD5: 05aa94d4b6f8e54d0077162a27b4f44d)
Examples in the R programming language
Download and read the dataset
Here is a sample script in R that downloads and reads the dataset:
# Load libraries -----
library(utils)
library(readr)

# Download -----
utils::download.file(
  url =
    paste0(
    "https://www.boleary.com/blog/posts/202501-ivd-decision-summaries/data/",
    "ivd_decision_summary_text.csv.gz"
  ),
  destfile = "ivd_decision_summary_text.csv.gz"
)

# Read -----
decision_summaries <-
  readr::read_delim(
    file = "ivd_decision_summary_text.csv.gz",
    delim = ";",
    col_types =
      readr::cols(
        submission_number = readr::col_character(),
        file_description = readr::col_character(),
        date_obtained = readr::col_date(),
        page_number = readr::col_integer(),
        text_embedded = readr::col_character(),
        text_ocr = readr::col_character()
      )
  )
Exploring the availability of IVD decision summaries
Exploring which IVD review processes are associated with public decision summaries
After downloading the data using the code above, we can cross reference it with datasets provided by the FDA to see which IVD review processes are associated with decision summaries and SSEDs.
Code
# First, download and read the data using the code in the previous example

if (!exists("decision_summaries")) {
  message(
    paste0(
      "Run the code from the previous example to download and read the ",
      "decision summary data"
    )
  )
}

# Load and install additional libraries -----
# Install the fdadata package from GitHub if it's missing
if (!require("fdadata", quietly = TRUE, warn.conflicts = FALSE)) {
  if (!require("devtools")) install.packages("devtools")
  devtools::install_github("bjoleary/fdadata")
}
library(dplyr, quietly = TRUE, warn.conflicts = FALSE)
library(tidyr, quietly = TRUE, warn.conflicts = FALSE)
library(janitor, quietly = TRUE, warn.conflicts = FALSE)

# Set up -----
# We will look at a specific date range.
fys_of_interest <- seq.int(from = 2005, to = 2024, by = 1)

# We will look at submissions in IVD panels
panels_of_interest <-
  c(
    "Clinical Chemistry",
    "Hematology",
    "Immunology",
    "Microbiology",
    "Clinical Toxicology",
    "Pathology",
    "Molecular Genetics"
  ) |>
  sort()

# Build a list of IVD submissions of interest
submissions_of_interest <-
  # Start with the information available in the fdadata package.
  # Note: If you adapt this analysis to look at recent submissions, you
  # will need to refresh this data rather than just using the dataset provided
  # in the package.
  fdadata::premarket |>
  # Add a column for FY decision
  dplyr::mutate(fy_decision = fdadata::fy(.data$date_decision)) |>
  # Combine the "track" and "type" columns into one column named
  # "review_process"
  tidyr::unite(
    col = "review_process",
    "type",
    "track",
    sep = ": ",
    na.rm = TRUE
  ) |>
  dplyr::mutate(review_process = forcats::as_factor(.data$review_process)) |>
  # Filter the dataset down to the submissions of interest based on the
  # panels and FYs we are looking at.
  dplyr::filter(
    .data$panel %in% panels_of_interest,
    .data$fy_decision %in% fys_of_interest
  ) |>
  # Add a column named "summary_available" that indicates whether or not there
  # is a decision summary or SSED for the submission in the decision_summaries
  # dataset.
  dplyr::mutate(
    summary_available =
      .data$submission_number %in% decision_summaries$submission_number
  )

# Filter the decision_summaries dataset down to the submissions of interest
# identified in the previous steps.
summaries_of_interest <-
  decision_summaries |>
  dplyr::filter(
    .data$submission_number %in% submissions_of_interest$submission_number
  )

# Count the number of decision summaries available and not available by
# review process
summary_availability <-
  submissions_of_interest |>
  # Group and count
  dplyr::group_by(
    .data$review_process,
    .data$summary_available,
    .drop = FALSE
  ) |>
  dplyr::tally()

# Calculate percentages of decision summaries available by review process
summary_availability_stats <-
  summary_availability |>
  tidyr::pivot_wider(
    names_from = "summary_available",
    values_from = "n",
    values_fill = 0L
  ) |>
  janitor::clean_names() |>
  dplyr::mutate(
    total = .data$false + .data$true,
    summary_proportion =
      dplyr::case_when(
        .data$false + .data$true > 0 ~
          .data$true / (.data$true + .data$false),
        # We also need to deal with processes that were not used for IVDs but
        # are still available, where the proportion will be 0 / 0. We'll set
        # this value to be negative to make it easier to sort them to the
        # bottom.
        TRUE ~ -Inf
      ),
    summary_proportion_string =
      dplyr::case_when(
        .data$false + .data$true > 0 ~
          paste0(
            .data$true, " / ", .data$true + .data$false, " = ",
            plyr::round_any(.data$true / (.data$true + .data$false) * 100, 1),
            "%"
          ),
        # We also need to deal with processes that were not used for IVDs but
        # are still available, where the proportion will be 0 / 0:
        TRUE ~ paste0(.data$true, " / ", .data$true + .data$false)
      )
  )

# Sort by review process by frequency of use...
summary_availability_stats$review_process <-
  forcats::fct_reorder(
    .f = summary_availability_stats$review_process,
    .x = summary_availability_stats$total,
    .na_rm = FALSE
  )
# ...and then by decision summary availability
summary_availability_stats$review_process <-
  forcats::fct_reorder(
    .f = summary_availability_stats$review_process,
    .x = summary_availability_stats$summary_proportion,
    .na_rm = FALSE
  )

# Plot the results
sum_plot <-
  ggplot2::ggplot(
    data = summary_availability_stats,
    mapping =
      ggplot2::aes(
        x = .data$review_process,
        y = .data$summary_proportion,
        label = .data$summary_proportion_string,
      )
  ) +
  ggplot2::geom_col(fill = "darkgray") +
  # Add text
  ggplot2::geom_text(
    mapping =
      ggplot2::aes(
        y = 0.05
      ),
    hjust = "left",
    size = 2.5
  ) +
  # Keep the axis simple
  ggplot2::scale_y_continuous(
    breaks = c(0, 1),
    labels = c("0", "100%"),
    # Add some padding near 100% so the axis label doesn't get clipped.
    expand = ggplot2::expansion(add = c(0, 0.05))
  ) +
  # Add a dashed line to the plot to make it easy to see where 100% is.
  ggplot2::geom_hline(yintercept = 1, linetype = "dashed") +
  # Add titles and such.
  ggplot2::labs(
    title = "Decision summary availability by review process",
    subtitle =
      paste0(
        "For FDA IVD decisions made in FY",
        min(fys_of_interest),
        " through FY",
        max(fys_of_interest)
      ),
    x = "Review Process",
    y = "Percent of decisions with decision summaries",
    caption =
      paste0(
        "Treat these results as estimates.\n",
        "Includes decision summaries for 510(k) and De Novo decisions and ",
        "SSEDs for PMA decisions."
      )
  ) +
  # Make the bars horizontal instead of vertical so the category labels and
  # text are easy to read.
  ggplot2::coord_flip() +
  ggplot2::theme_classic()

plot(sum_plot)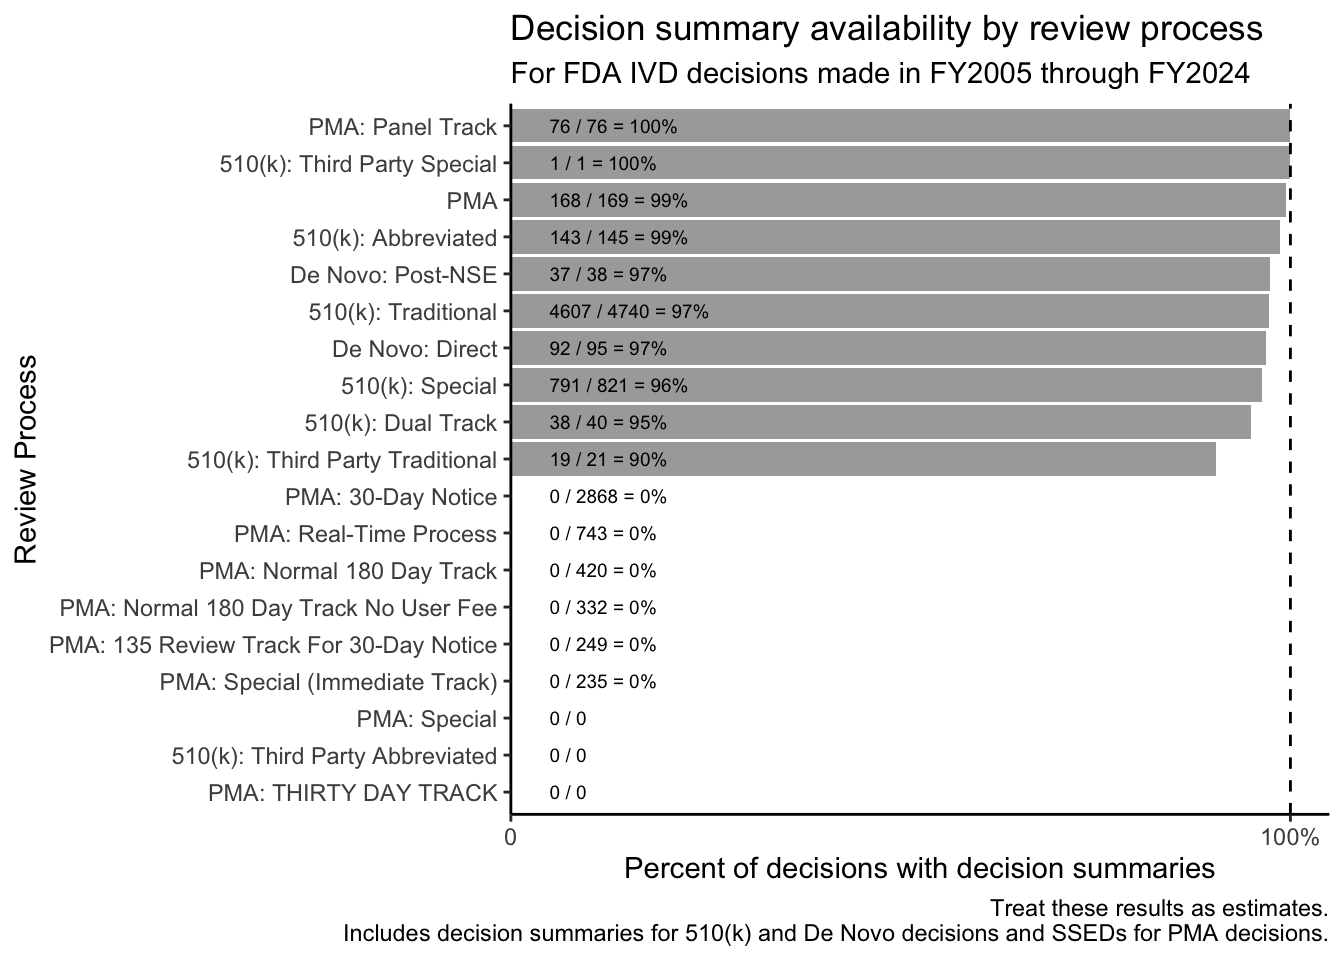
For IVDs, the FDA frequently issues decision summaries for original and panel track PMAs, for De Novos, and for 510(k)s.
Exploring which IVD review processes result in shorter and longer decision summaries
The FDA’s regulations and review processes are intended to result in the availability of medical devices that are safe and effective. Some decisions are more difficult to make than others, and different review processes tend to result in different amounts of information being included in decision summaries. One simple related measure is page count, which is readily available in this dataset:
Code
# Calculate page counts for each summary
summary_page_count <-
  dplyr::left_join(
    x =
      summaries_of_interest |>
      dplyr::group_by(
        .data$submission_number
      ) |>
      # Identify the highest page number for each submission
      dplyr::summarise(
        page_count = max(.data$page_number)
      ),
    y = submissions_of_interest,
    by = c("submission_number" = "submission_number")
  ) |>
  dplyr::group_by(
    .data$review_process,
    .data$page_count,
    # Remove unused review processes for this analysis.
    .drop = TRUE
  ) |>
  dplyr::tally() |>
  # Set colors for higher an lower page counts
  dplyr::mutate(
    fill_color =
      dplyr::case_when(
        .data$page_count <= 2L ~ "darkred",
        TRUE ~ "darkgray"
      )
  )

# For this plot, sort review processes alphabetically
summary_page_count$review_process <-
  forcats::fct_relevel(
    .f = summary_page_count$review_process,
    sort
  )

# Plot
ggplot2::ggplot(
  data = summary_page_count,
  mapping =
    ggplot2::aes(
      x = .data$page_count,
      y = .data$n,
      fill = .data$fill_color
    )
) +
  ggplot2::facet_wrap(
    # One facet per review process
    ~.data$review_process,
    ncol = 3L,
    # Let the y-axis vary by review process, but hold the x-axis constant
    # across facets.
    scales = "free_y",
    drop = TRUE
  ) +
  ggplot2::geom_col() +
  ggplot2::labs(
    title = "Number of pages in FDA IVD decision summaries by review process",
    subtitle =
      paste0(
        "For summaries of decisions made in FY",
        min(fys_of_interest),
        " through FY",
        max(fys_of_interest)
      ),
    x = "Number of pages in decision summary",
    y = "Number of decision summaries",
    caption =
      paste0(
        "Page counts that are less than or equal to 2 are highlighted in red.",
        "\n",
        "Treat these results as estimates.\n",
        "Includes decision summaries for 510(k) and De Novo decisions and ",
        "SSEDs for PMA decisions."
      )
  ) +
  ggplot2::scale_y_continuous(
    # Keep the y-axis breaks and labels to a minimum
    breaks = scales::extended_breaks(3)
  ) +
  ggplot2::scale_fill_manual(values = c("darkgray", "red")) +
  ggplot2::theme_classic() +
  # No legend -- we'll use the figure caption instead.
  ggplot2::guides(fill = "none")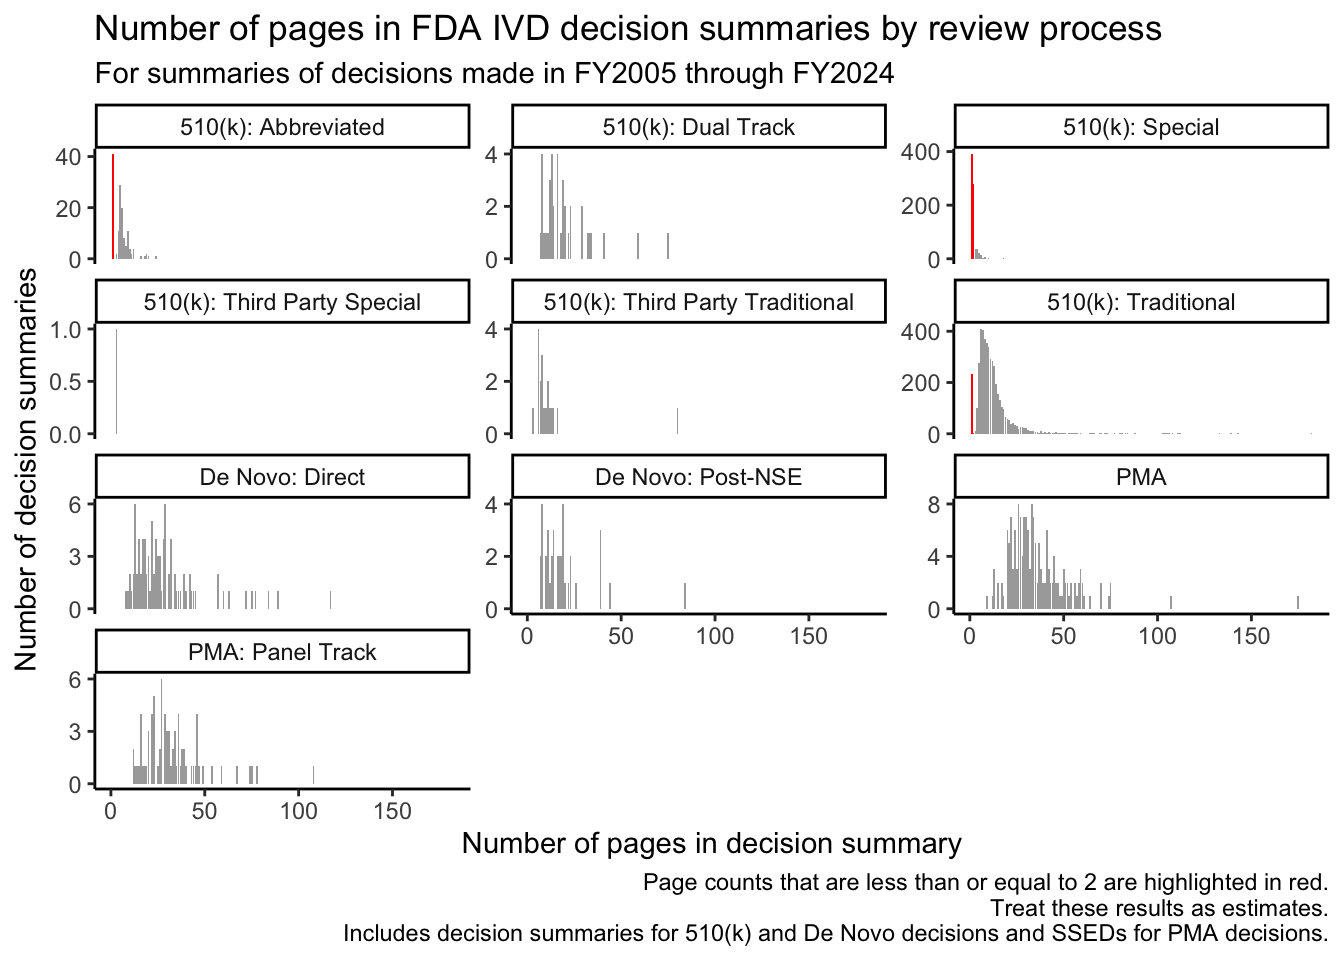
The red bars in Figure 2 illustrate that decision summaries may only be a page or two long for many submissions that go through the Special and Abbreviated 510(k) review processes and for a significant subset of those that go through the Traditional 510(k) review process.
Special 510(k)s are “for certain well-defined device modifications where a manufacturer modifies its own legally marketed device, and design control procedures produce reliable results that can form, in addition to other 510(k) content requirements, the basis for substantial equivalence (SE).” [1, p. 4] Similarly, Abbreviated 510(k) reviews “[rely] on guidance documents, special controls, and/or voluntary consensus standards” [2, p. 3] and on “summary reports” based on these approaches. In both cases, it makes sense that the FDA’s summary of its decision-making may be brief.
For Traditional 510(k)s, single-page decision summaries tend to be associated with the FDA’s “Triage-Quick Review Program,” where the posted decision summary consists of template language that refers users to the 510(k) summary for information about the basis for the FDA’s decision. Triage-Quick Review Program decision summaries also note that “This program represents an internal workload management tool intended to reduce internal FDA review resources for 510(k) applications that are of good quality upon receipt by FDA.”2 The FDA’s use of this program for Traditional 510(k)s peaked for decisions made in FY2015.
NoteFiscal Years
The FDA’s fiscal years begin in October and end in September. For example: FY2025 began on 2024-10-01. For more on fiscal years and decision cohorts, see this post.
Code
# Identify Traditional 510(k) decisions that may have gone through the
# Triage-Quick Review Program, meaning that their decision summaries are less
# than 3 pages long.
triage_quick_review_likely <-
  dplyr::left_join(
    x = submissions_of_interest,
    y =
      summaries_of_interest |>
      dplyr::group_by(.data$submission_number) |>
      dplyr::summarise(
        short_summary = max(.data$page_number) < 3
      ),
    by = c("submission_number" = "submission_number")
  ) |>
  dplyr::filter(
    .data$review_process %in% c("510(k): Traditional"),
    .data$short_summary
  )

# Check for the presence of the word "Triage" in the summaries identified in
# the previous step.
triage_confirmed <-
  decision_summaries |>
  dplyr::filter(
    .data$submission_number %in% triage_quick_review_likely$submission_number
    ) |>
  # Make one text field to search for each submission.
  tidyr::unite(col = "text_to_search", "text_embedded", "text_ocr") |>
  dplyr::select(
    "submission_number",
    "text_to_search"
  ) |>
  dplyr::group_by(.data$submission_number) |>
  dplyr::summarise(
    text_to_search = paste0(.data$text_to_search, collapse = " ")
  ) |>
  # Check for the word "Triage"
  dplyr::mutate(
    triage_confirmed =
      stringr::str_detect(
        string = .data$text_to_search,
        pattern = stringr::fixed("Triage", ignore_case = TRUE)
      )
  ) |>
  # Join in the submissions of interest dataset.
  dplyr::right_join(
    y = submissions_of_interest,
    by = c("submission_number" = "submission_number")
  ) |>
    dplyr::filter(
    .data$review_process %in% c("510(k): Traditional")
  ) |>
  # Group by fiscal year of decision and count
  dplyr::group_by(.data$fy_decision) |>
  dplyr::summarise(
    n = n(),
    triage = sum(.data$triage_confirmed, na.rm = TRUE)
  ) |>
  # Calculate percentages by year
  dplyr::mutate(
    percent = .data$triage / .data$n,
    string =
      dplyr::case_when(
        .data$triage > 0 ~
          paste0(
            .data$triage, " / ", .data$n, "\n(",
            plyr::round_any(.data$triage / .data$n * 100, 1),
            "%)"
          ),
        TRUE ~ " "
      )
  )

# Plot
ggplot2::ggplot(
  data = triage_confirmed,
  mapping =
    ggplot2::aes(
      x = .data$fy_decision,
      y = .data$percent,
      label = .data$string
    )
) +
  ggplot2::geom_col(fill = "darkgray") +
  ggplot2::geom_text(size = 1.75, vjust = 1.25) +
  ggplot2::scale_x_continuous(
    breaks = fys_of_interest[(fys_of_interest %% 2) == 0]
  ) +
  ggplot2::scale_y_continuous(
    expand = c(0, NA),
    # Set the y-axis limit to a reasonable, human-friendly value
    limits =
      c(
        0,
        plyr::round_any(
          x = max(triage_confirmed$percent, na.rm = TRUE),
          accuracy = 0.05,
          f = ceiling
        )
      ),
    labels = scales::label_percent()
  ) +
  ggplot2::labs(
    title = "Estimated use of the Triage-Quick Review Program over time",
    subtitle =
      paste0(
        "For IVD Traditional 510(k)s with decisions made in FY",
        min(fys_of_interest),
        " through FY",
        max(fys_of_interest)
      ),
    x = "FY Decision",
    y = "Traditional 510(k)s in Triage-Quick Review Program",
    caption =
      paste0(
        "Treat these results as estimates.\n",
        "Triage-Quick Review submissions were identified based on the length ",
        "and content of decision summary documents."
      )
  ) +
ggplot2::theme_classic() 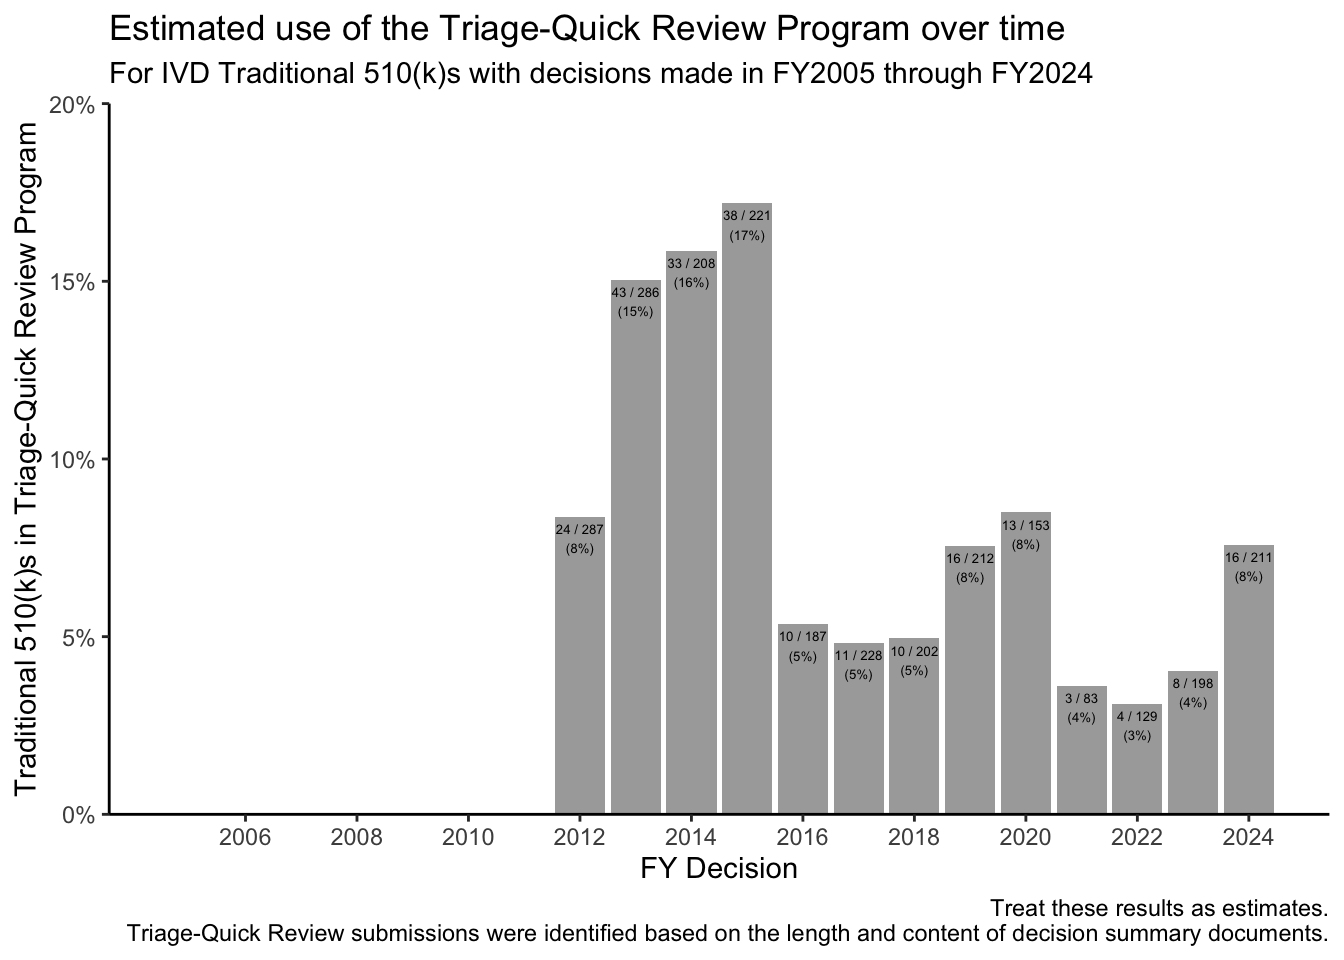
Given that a summary that is only a page or two long may not be as informative or interesting, we can revise Figure 1 and visualize the rate at which longer decision summaries are available by review process:
Code
# Similar to the first plot, but this time, limit it to those with decision
# summaries longer than 2 pages.
long_summary_availability <-
  dplyr::left_join(
    x = submissions_of_interest,
    y =
      summaries_of_interest |>
      dplyr::group_by(.data$submission_number) |>
      dplyr::summarise(
        long_summary = max(.data$page_number) > 2
      ),
    by = c("submission_number" = "submission_number")
  ) |>
  # Calculate a composite metric that we can use to say whether or not a
  # decision summary is available and is greater than 2 pages long.
  dplyr::mutate(
    long_summary_composite =
      dplyr::case_when(
        is.na(.data$long_summary) ~ FALSE,
        .data$long_summary == FALSE ~ FALSE,
        .data$summary_available == FALSE ~ FALSE,
        .data$long_summary == TRUE ~ TRUE
      )
  ) |>
  # Group and count
  dplyr::group_by(
    .data$review_process,
    .data$long_summary_composite,
    .drop = FALSE
  ) |>
  dplyr::tally()

# Calculate percentages
long_summary_availability_stats <-
  long_summary_availability |>
  tidyr::pivot_wider(
    names_from = "long_summary_composite",
    values_from = "n",
    values_fill = 0L
  ) |>
  janitor::clean_names() |>
  dplyr::mutate(
    total = .data$false + .data$true,
    summary_proportion = .data$true / (.data$true + .data$false),
    summary_proportion_string =
      paste0(
        .data$true, " / ", .data$true + .data$false, " = ",
        plyr::round_any(.data$true / (.data$true + .data$false) * 100, 1),
        "%"
      )
  ) |>
  dplyr::arrange(
    dplyr::desc(.data$total)
  )

# Sort by review process by frequency of use...
long_summary_availability_stats$review_process <-
  forcats::fct_reorder(
    .f = long_summary_availability_stats$review_process,
    .x = long_summary_availability_stats$total,
    .na_rm = FALSE
  )
# ...and then by decision summary availability
long_summary_availability_stats$review_process <-
  forcats::fct_reorder(
    .f = long_summary_availability_stats$review_process,
    .x = long_summary_availability_stats$summary_proportion,
    .na_rm = TRUE
  )

# Plot
long_sum_plot <-
  ggplot2::ggplot(
    data =
      long_summary_availability_stats |>
      dplyr::filter(.data$summary_proportion > 0),
    mapping =
      ggplot2::aes(
        x = .data$review_process,
        y = .data$summary_proportion,
        label = .data$summary_proportion_string,
      )
  ) +
  ggplot2::geom_col(fill = "darkgray") +
  ggplot2::geom_text(
    mapping =
      ggplot2::aes(
        y = 0.02
      ),
    hjust = "left",
    size = 2.5
  ) +
  ggplot2::scale_y_continuous(
    breaks = c(0, 1),
    labels = c("0", "100%"),
    expand = ggplot2::expansion(add = c(0, 0.05))
  ) +
  ggplot2::labs(
    title =
      paste0(
        "Availability of decision summaries longer ",
        "than 2 pages \n",
        "by review process"
        ),
    subtitle =
      paste0(
        "For FDA IVD decisions made in FY",
        min(fys_of_interest),
        " through FY",
        max(fys_of_interest)
      ),
    x = "Review Process",
    y = "Percent of decisions with decision summaries >2 pages",
    caption =
      paste0(
        "Treat these results as estimates.\n",
        "Includes decision summaries for 510(k) and De Novo decisions and ",
        "SSEDs for PMA decisions."
      )
  ) +
  ggplot2::geom_hline(yintercept = 1, linetype = "dashed") +
  ggplot2::coord_flip() +
  ggplot2::theme_classic()

plot(long_sum_plot)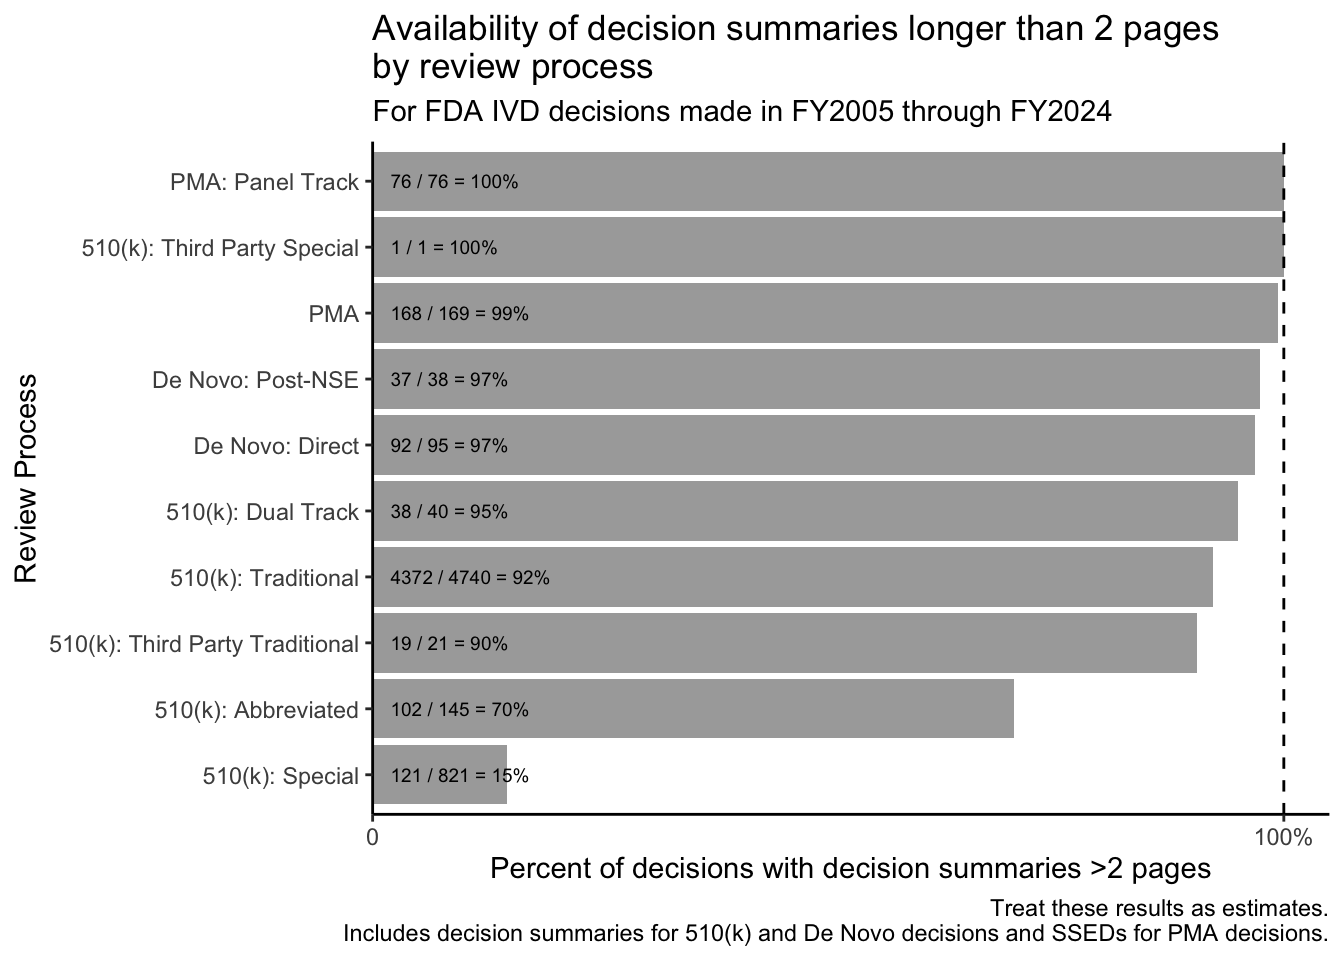
Many decision summaries are (appropriately) brief. For example, while the FDA published decision summaries for 791 / 821 = 96% of IVD decisions made through the Special 510(k) process (see Figure 1), only 121 / 821 = 15% of IVD Special 510(k) decisions are associated with decision summaries that are longer than 2 pages.
Exploring the use of FDA-recognized CLSI publications
Many IVD reviews rely on the use of standards and guidelines from the Clinical and Laboratory Standards Institute (CLSI). The FDA “recognizes” many CLSI publications, meaning that the FDA has determined that the approaches described in these documents can help manufacturers meet regulatory requirements. [3, p. 2] The FDA maintains a helpful database of FDA-recognized standards, and this database allows one to export a list of FDA-recognized CLSI publications to a CSV file.
We can use the exported list of FDA-recognized CLSI publications to build search terms, and then we can see how often those terms appear in the FDA’s decision summaries.
We’ll look for each of these terms in decision summaries for decisions made in FY2023.
Code
# Get the file from FDA.gov or download it here:
# fs::dir_create("data-raw/")
# utils::download.file(
#   url =
#     paste0(
#       "https://www.boleary.com/blog/posts/202410-ivd-decision-summaries/",
#       "data/clsi_standards.csv"
#     ),
#   destfile = "data-raw/clsi_standards.csv"
# )

if (!exists("submissions_of_interest")) {
  message("Run the code from the previous examples first.")
}
if (!exists("decision_summaries")) {
  message("Run the code from the previous examples first.")
}

# Load additional libraries -----
library(stringr)

# Read in the standards data -----
clsi_standards <-
  readr::read_delim(
    # Make sure your CLSI standards file is saved at this path:
    file = "data-raw/clsi_standards.csv",
    col_types =
      readr::cols(
        `Date of Entry` = readr::col_character(),
        `Specialty Task Group Area` = readr::col_character(),
        `Recognition Number` = readr::col_character(),
        `Extent of Recognition` = readr::col_character(),
        `Standard Developing Organization` = readr::col_character(),
        `Standard Designation Number/Date` = readr::col_character(),
        ` Title of Standard` = readr::col_character(),
        `Transition Expiration Date` = readr::col_character()
      )
  ) |>
  janitor::clean_names() |>
  dplyr::mutate(
    date_of_entry = lubridate::mdy(.data$date_of_entry),
    transition_expiration_date =
      lubridate::mdy(.data$transition_expiration_date),
    standard_name =
      stringr::str_extract(
        string = .data$standard_designation_number_date,
        # This pattern should grab the first "word" that is the main
        # identifier for the standard.
        pattern = "^[\\w/-]*"
      ) |>
      stringr::str_remove(
        # This pattern should remove "-1st", "-2nd", "-3rd", "4th", etc.
        pattern = stringr::regex("-\\d*(st|nd|rd|th)")
      )
  ) |>
  dplyr::mutate(
    standard_name_length = stringr::str_length(.data$standard_name)
  ) |>
  dplyr::select(
    "standard_designation_number_date",
    "standard_name",
    "standard_name_length",
    dplyr::everything()
  )

# Confirm that the number of unique values in "standard_name" is the same as
# the number of rows in the table.
duplicates <-
  length(clsi_standards$standard_name) != length(unique(clsi_standards$standard_name))
if (duplicates) {
  message(
    paste0(
      "At least one search term is showing up more than once. ",
      "As of this writing, both the 5th and 6th edition of CLSI M23 are ",
      "recognized, so this is expected. Consider doing a manual check."
      ) |>
      stringr::str_wrap(width = 75)
  )
}

# Search -----
search_terms <-
  unique(sort(clsi_standards$standard_name))

# Put word boundaries around the search terms and make them case-insensitive
search_terms_regex <-
  paste0(search_terms, "\\b[^-]") |>
  stringr::regex(ignore_case = TRUE)

# Identify IVD decisions made in FY2023
ivd_2023 <-
  submissions_of_interest |>
  dplyr::filter(
    .data$date_decision >= lubridate::ymd("2022-10-01"),
    .data$date_decision < lubridate::ymd("2023-10-01")
  )

# Structure the data to be searched
search_domain <-
  decision_summaries |>
  dplyr::filter(.data$submission_number %in% ivd_2023$submission_number) |>
  # Make one text field for each submission
  tidyr::unite(col = "text_to_search", "text_embedded", "text_ocr") |>
  dplyr::select(
    "submission_number",
    "text_to_search"
  ) |>
  dplyr::group_by(.data$submission_number) |>
  dplyr::summarise(
    text_to_search = paste0(.data$text_to_search, collapse = " ")
  )

# For each search term, add a new column with the search results.
for (i in seq_along(search_terms)) {
  column_name <- search_terms[[i]]
  search_domain <-
    search_domain |>
    dplyr::mutate(
      {{ column_name }} :=
        stringr::str_detect(
          string = .data$text_to_search,
          pattern = search_terms_regex[[i]]
        )
    )
}

# Tally up the search results for each term.
search_results <-
  search_domain |>
  dplyr::select(-"text_to_search") |>
  tidyr::pivot_longer(
    cols = tidyr::all_of(search_terms),
    names_to = "search_term",
    values_to = "result"
  ) |>
  dplyr::group_by(.data$search_term) |>
  dplyr::summarise(count = sum(.data$result)) |>
  dplyr::filter(.data$count > 0) |>
  # Sort by frequency
  dplyr::arrange(.data$count) |>
  # Join in some metadata about the CLSI documents
  dplyr::left_join(
    y =
      clsi_standards |>
      dplyr::select("standard_name", "title_of_standard"),
    by = c("search_term" = "standard_name")
  ) |>
  dplyr::mutate(search_term = forcats::as_factor(.data$search_term))

# Save the results
readr::write_excel_csv(
  x = search_results,
  file = "data/search_results.csv"
)

# Plot the top 10 results
top_number <- 10
ggplot2::ggplot(
  data = search_results |> tail(top_number),
  mapping =
    ggplot2::aes(
      x = .data$search_term,
      y = .data$count
    )
) +
  ggplot2::geom_col(
    color = "lightgray",
    fill = "lightgray"
  ) +
  ggplot2::geom_text(
    mapping =
      ggplot2::aes(
        y = 1,
        label =
          paste0(
            .data$title_of_standard |>
              stringr::str_trunc(width = 100),
            "\n",
            "Referenced in ",
            .data$count,
            " decision summaries"
          ),
      ),
    hjust = 0,
    color = "black",
    size = 3
  )+
  ggplot2::labs(
    title =
      paste0(
        "Top ",
        top_number,
        " CLSI documents referenced in FDA decision summaries"
      ),
    subtitle = "For IVD decisions made in FY2023",
    x = "CLSI document",
    y = "Count of FDA decision summaries found to reference the CLSI Document",
    caption =
      paste0(
        "Treat these results as estimates.\n",
        "Includes decision summaries for 510(k) and De Novo decisions and ",
        "SSEDs for PMA decisions."
      )
  ) +
  ggplot2::coord_flip() +
  ggplot2::theme_classic()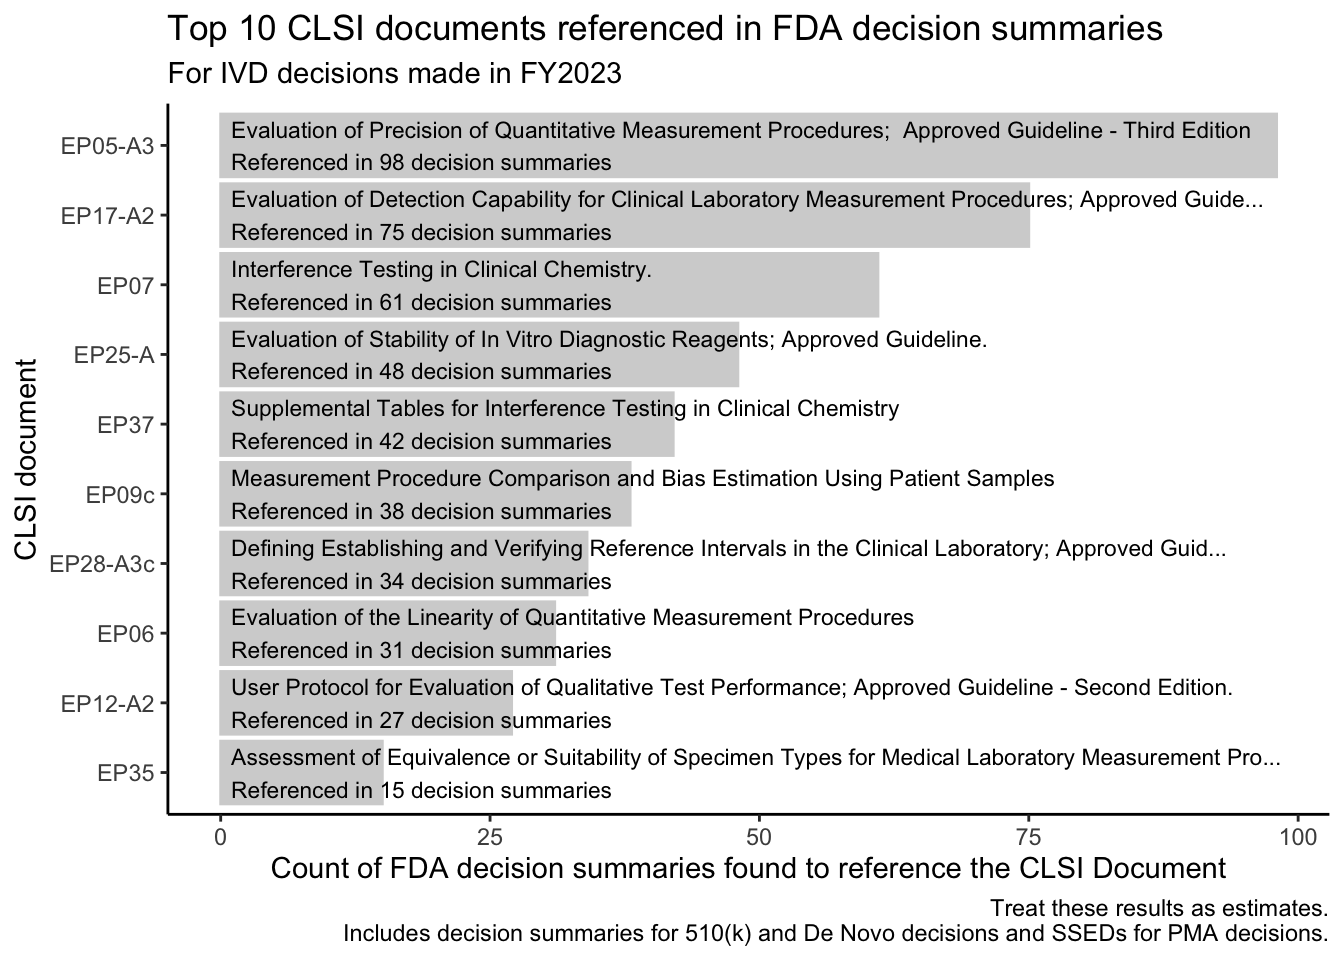
CLSI’s “EP” documents (evaluation protocols) feature prominently in the results (CSV), with protocols for evaluating quantitative tests topping the list.
References
[1]
“The special 510(k) program,” U.S. Food and Drug Administration, Final Guidance Document. Docket Number FDA-2018-D-3304, Sep. 2019. Available: https://www.regulations.gov/document/FDA-2018-D-3304-0018
[2]
“The abbreviated 510(k) program,” U.S. Food and Drug Administration, Final Guidance Document. Docket Number FDA-2019-D-4015, Sep. 2019. Available: https://www.regulations.gov/document/FDA-2019-D-4015-0001
[3]
“Recognition and withdrawal of voluntary consensus standards,” U.S. Food and Drug Administration, Final Guidance Document. Docket Number FDA-2018-D-2936, Sep. 2020. Available: https://www.regulations.gov/document/FDA-2018-D-2936-0010
Footnotes
I’ll use the term “IVD” throughout this post for convenience and readability, and, for the purposes of this post, “IVD” includes anything the FDA has reviewed and authorized under one of its IVD review panels: Clinical Chemistry, Clinical Toxicology, Hematology, Immunology, Microbiology, Molecular Genetics, and Pathology. As of publication, the FDA includes laboratory developed tests (LDTs) or laboratory developed procedures (LDPs) in its use of the term “IVD,” and the FDA has authorized some LDTs or LDPs through the premarket programs discussed here.↩︎
See, for example: https://www.accessdata.fda.gov/cdrh_docs/reviews/K242540.pdf.↩︎