Downloadable spreadsheets and graphs of the FDA’s medical device review performance metrics

The FDA publishes quarterly and annual reports that include performance metrics for the medical device review process. These reports can include thousands of performance metrics in a series of tables, and they are published as PDFs that regularly exceed three hundred pages. This post makes many of these metrics available for download in spreadsheets and as a data package for the R programming language, making the data easier to analyze and use. This post also provides novel visualizations of 510(k) program performance metrics over time and by review group.
Introduction
Each quarter, the FDA publishes public performance reports on regulatory activities associated with the medical device review program. These reports are published as PDFs, which can make it difficult to analyze and use the data. And there’s a lot of data. For example, the most recent MDUFA IV performance report includes more than 14,000 individual performance metrics. When finished, the FDA is on track to publish more than 13,000 individual performance metrics from the MDUFA 5 program. For contrast, the MDUFA 2 program only resulted in about 240 published metrics. To make this information easier to access, analyze, and use, I’ve written software to scrape the PDF reports and extract most of the data.
You can download the resulting datasets below. They include more than 24,600 performance metrics.
This post also provides:
- A plot of 510(k) volume by review group over time, including projections of future 510(k) volume
- A plot of which 510(k) receipt cohorts are associated with final data
- Plots that show how long 510(k)s spend “under review” with different review groups at the FDA
- A plot that shows how long 510(k)s spend “on hold” while applicants respond to the FDA’s questions by FDA review group
- Plots that show how long the 510(k) review process takes overall by FDA review group
- Plots that show about how often different FDA review groups make substantive requests for additional information from 510(k) applicants
- A plot that shows the rates at which different FDA review groups have cleared 510(k)s over time
These plots are based on the information in the December 10, 2018 MDUFA 3 report and the November 16, 2023 MDUFA 4 and MDUFA 5 reports. [1] [2] [3] Information about various factors that may affect this data and a glossary of MDUFA jargon are also included in this post.
Downloads
You can download all of the figures in this post as a single PDF that should print well on letter paper. Throughout this post, the captions for each figure include links to CSV files that contain the data used in the figures.
You can access data from the FDA’s MDUFA performance reports in spreadsheet form here:
I provide digital health and medical device regulatory strategy solutions to technology developers, healthcare organizations, trade and professional associations, and others. Book a consultation.
- mdufa2.xlsx (File size: 39.8K)
- mdufa3.xlsx (File size: 491.5K)
- mdufa4.xlsx (File size: 904.3K)
- mdufa5.xlsx (File size: 795.7K)
Aside from some spot-checks, the datasets provided here have had limited verification and may include some errors.
In addition, data from some tables in the FDA’s MDUFA performance reports are missing from these datasets.
Use this information at your own risk and verify information using the reports provided directly by the FDA. To facilitate this, each data point provided includes information about its source, including a link to the FDA report from which it came, the relevant page number, and more. If you find a problem in these datasets, please report the problem here.
If you’re familiar with the R programming language, you can also access these datasets using the mdufa package, which is available on GitHub. You are welcome to use and modify this software, including for commercial purposes, under the MIT license. (In addition, this post is under the CC BY license, which permits sharing and adaptation, including commercially.)
Context for these datasets
This post includes visualizations of performance metrics related to the “Medical Device User Fee Amendments” or “MDUFA.” Every five years since fiscal year (FY) 2003, Congress has authorized (or re-authorized) the FDA to collect user fees to support the FDA’s regulatory activities related to medical devices. Each of these five-year periods has been named sequentially: MDUFA or MDUFA I (FY 2003 through FY 2007), MDUFA II (FY 2008 through FY 2012), MDUFA III (FY 2013 through FY 2017), MDUFA IV (FY 2018 through FY 2022) and MDUFA V (FY 2023 through FY 2027).
This post will use “MDUFA 1,” “MDUFA 2,” “MDUFA 3,” “MDUFA 4,” and “MDUFA 5” to refer to these periods. The term “MDUFA” will be used to refer to any or all of these periods.
Before each re-authorization, the FDA has negotiated with representatives from the medical device industry, patient representatives, and other members of the public to arrive at a set of commitments that can be kept given the additional resources user fees provide. This results in a “MDUFA Commitment Letter,” a draft of which is provided to Congress in advance of re-authorization.
As a result of these commitments, since at least MDUFA 2, the FDA has published quarterly and annual “MDUFA Reports” that include performance metrics related to the FDA’s medical device regulatory activities with a particular focus on review times for premarket submissions for medical devices.
Definitions
The definitions below are based on the information in the MDUFA 5 Commitment Letter with some simplifications. [4]
- Applicant
- The person or organization providing a 510(k) or other submission to the FDA. [4, p. 32]
- FDA Days
- The number of calendar days that a submission was “under review” at the FDA, not including:
- any time the FDA spent reviewing information that could not be accepted or filed because it was not administratively complete, or
- any time the FDA spent waiting for an applicant to respond to a substantive request for additional information. [4, p. 32]
- Fiscal Year (FY):
- A period beginning on October 1 and ending on the following September 30. For example, the period between 2023-10-01 and 2024-09-30 is “FY 2024.”
- Industry Days
- The number of calendar days an administratively complete submission was “on hold” while the FDA waited for an applicant to respond to a substantive request for additional information.
- MDUFA Decision
- For 510(k)s, a decision that a device is substantially equivalent (“SE” or “cleared”) and can be marketed in the U.S. or a decision that a device is not substantially equivalent (“NSE” or “not cleared”) and cannot be marketed in the U.S. [4, pp. 32–33] Throughout this post, this is referred to simply as a “decision.”
- MDUFA Performance Report Cutoff Date
- The date as of which the performance metrics in a MDUFA performance report were calculated. For the data included in this post, those dates are 2018-09-30 for MDUFA 3 and 2023-09-30 for MDUFA 4 and MDUFA 5. [1, p. 1] [2, p. 1] [3, p. 1]
- Review Cycle
- A period of FDA Days during which an accepted submission is “under review” at the FDA that is terminated by either a substantive request for additional information or a decision. For example, a submission that is cleared by the FDA without going “on hold” has one review cycle. A submission that the FDA places “on hold” through a substantive request for additional information, is then supplemented by the applicant with additional information, and then goes “under review” for a second time at the FDA before a final decision is made has two review cycles.1
- Total Days
- The number of calendar days from the FDA’s receipt of an administratively complete submission to a MDUFA Decision. When calculating summary statistics on this metric, the FDA excludes certain outlier submissions. The criteria that determine which outliers should be excluded change from year-to-year. [4, p. 35]
\[\text{Total Days} = \text{FDA Days} + \text{Industry Days}\]
Metrics based on receipt cohorts are lagging indicators
Performance metrics included in the MDUFA reports are calculated across submissions grouped by the fiscal year in which they were received. These groups of submissions are called “receipt cohorts.” Grouping submissions by the fiscal year in which the FDA made a decision on the submissions results in groups of submissions called “decision cohorts.”
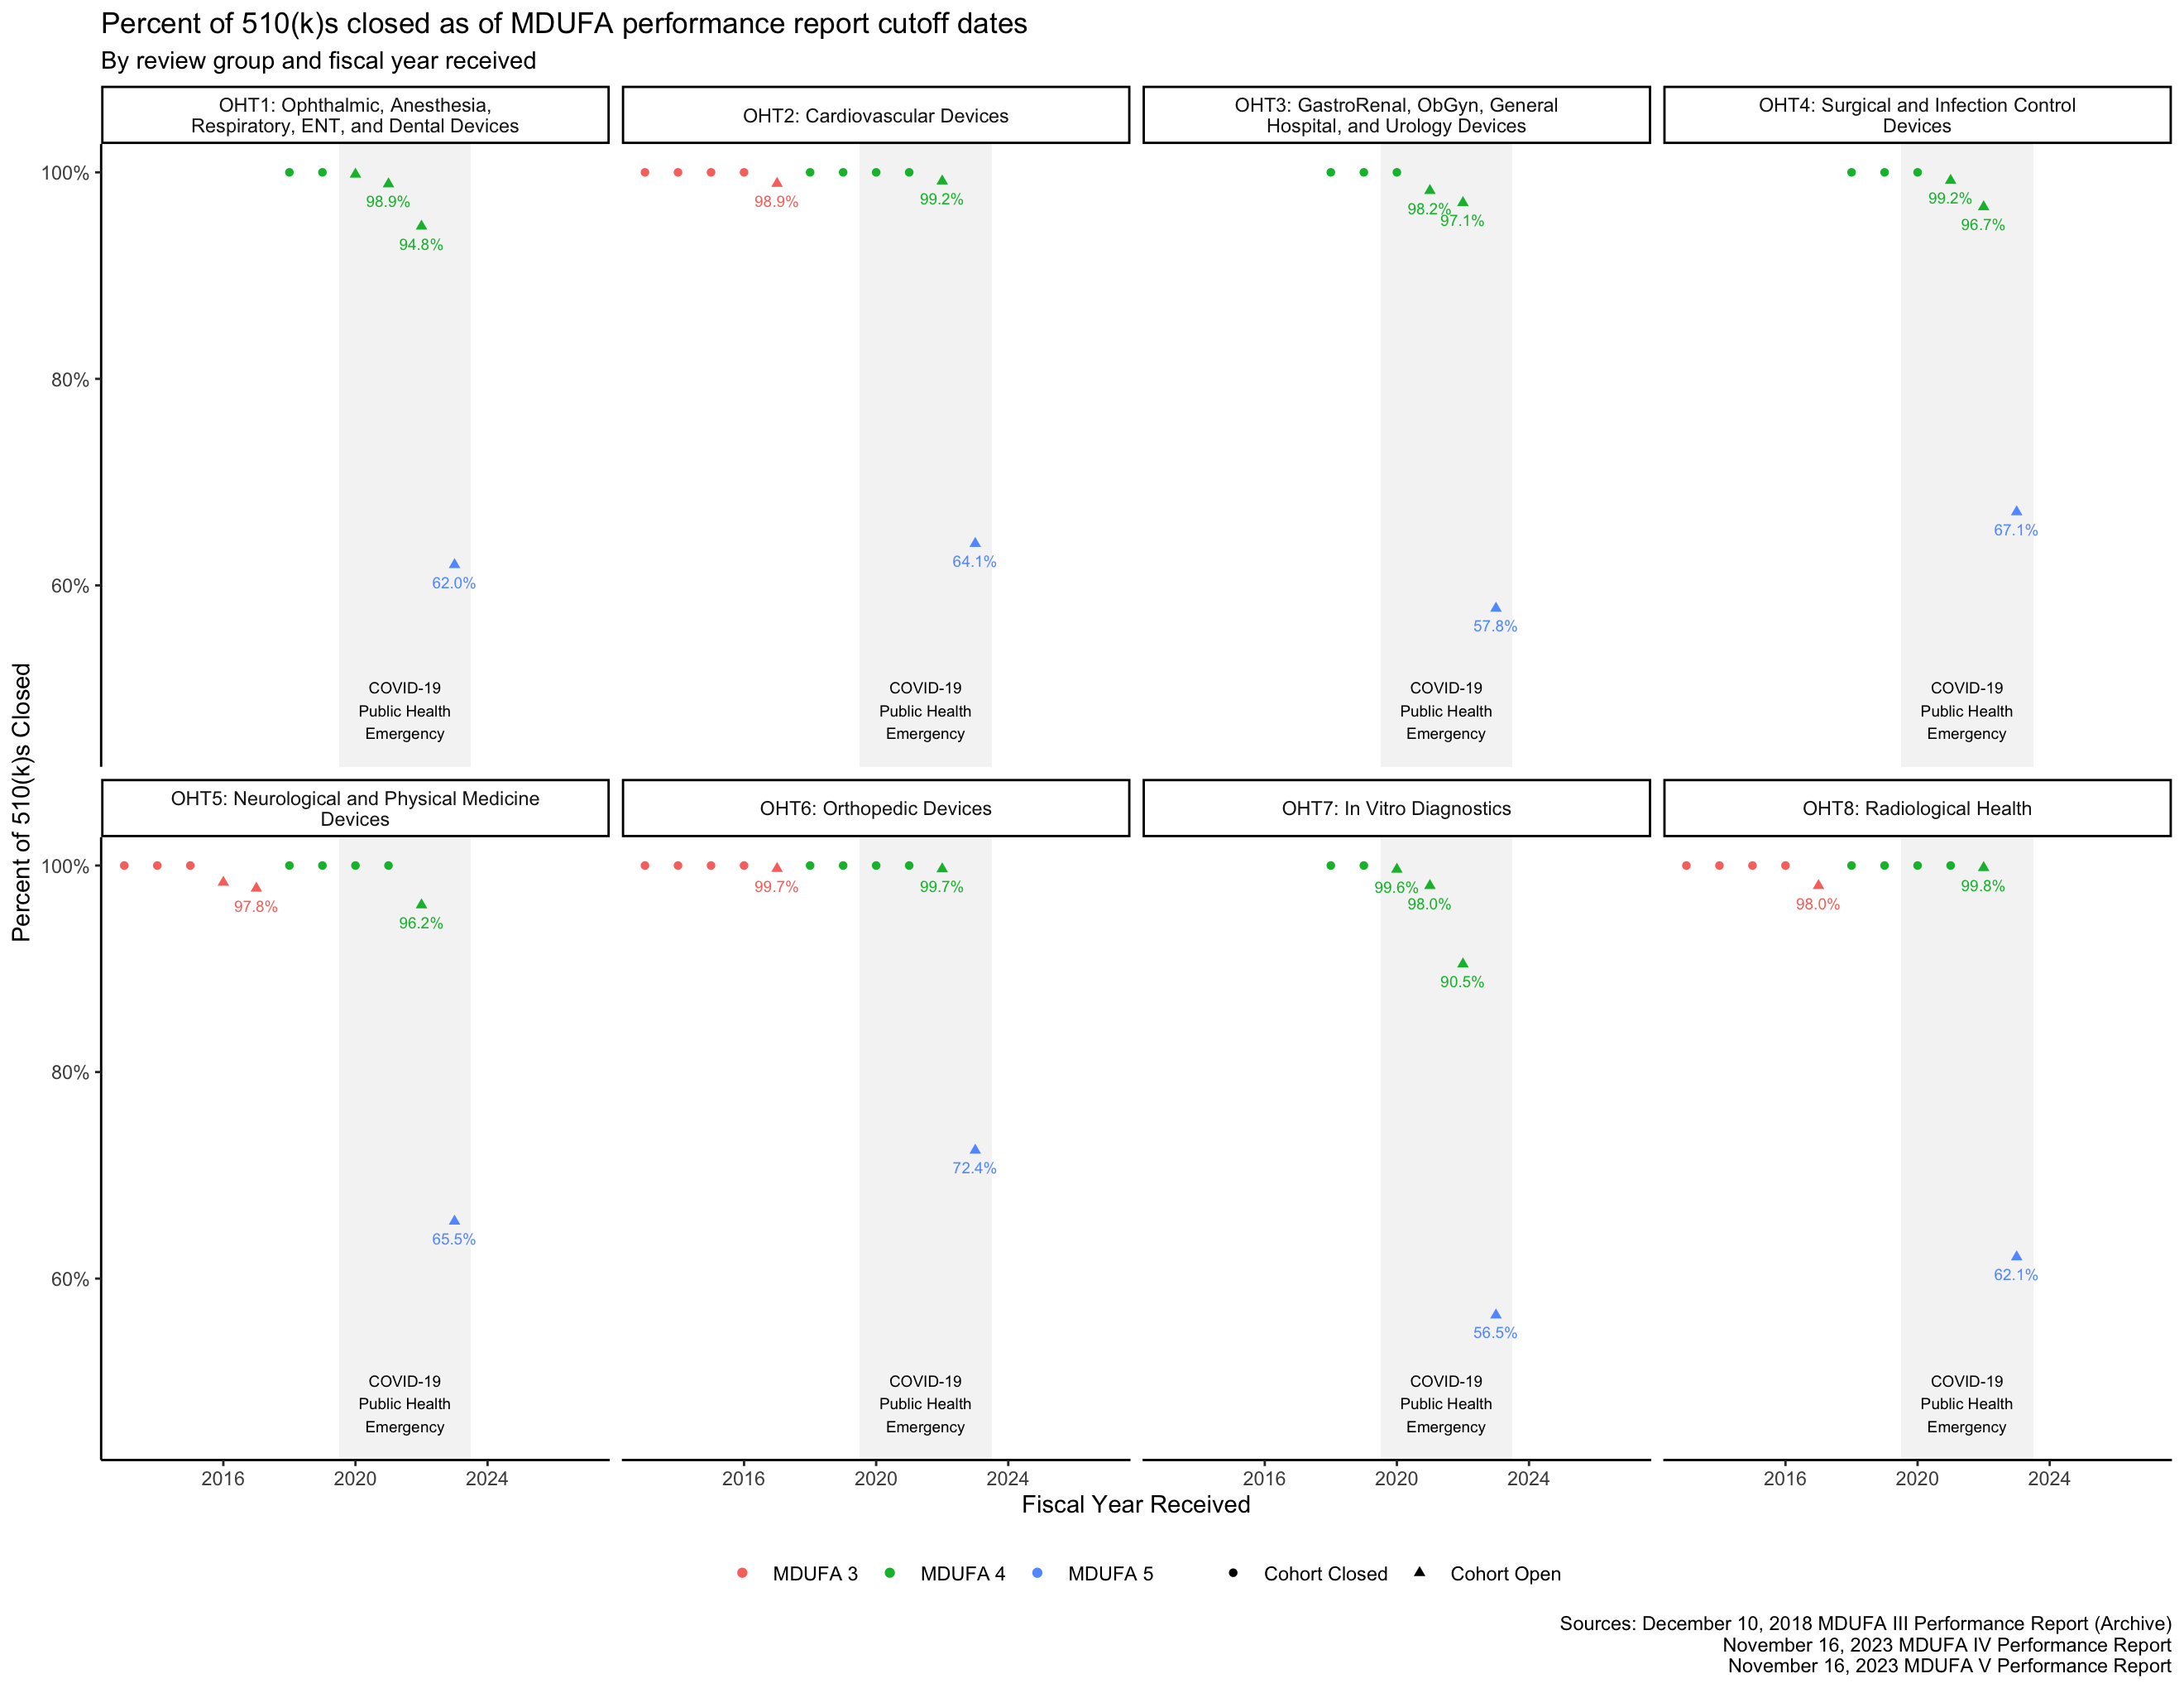
As of this writing, the FY 2023 510(k) receipt cohort includes many submissions for which the FDA has not made a final decision. This means that the FY 2023 510(k) receipt cohort is “open.” See Figure 2, which shows that, as of the most recent MDUFA 5 report, as many as 40% or more of the 510(k)s received in FY 2023 by some of the FDA’s medical device review groups remain under review. As review days continue to accumulate for these 510(k)s, the performance metrics that are based on those review times will change as well. Performance metrics calculated across open receipt cohorts continue to change until those cohorts “close,” which happens when each submission in the receipt cohort has received a decision.
Recent receipt cohorts are typically open. This means that performance metrics associated with these receipt cohorts, on their own, do not provide a particularly accurate indicator of final performance on those cohorts. It takes a while for them to stabilize. Before they stabilize, performance metrics associated with open receipt cohorts provide overly optimistic estimates of performance.2
While this post can help you understand how the FDA performed on closed receipt cohorts from past years, the MDUFA reports and this post will not provide you with much useful information about how things are going at the FDA right now, and data from open receipt cohorts should be interpreted with caution.
Reorganizations impacted these datasets
MDUFA 3 data is included for some review groups in the figures below and is not included for others. This is a result of reorganizations at the FDA. A major reorganization occurred on September 30, 2019, and a subsequent, smaller reorganization occurred later.
In some cases, the reorganizations took premarket review groups that already existed and were included in the MDUFA 3 reports and renamed them.3 This is essentially the case for OHT2, OHT5, OHT6, and OHT8, meaning that data for those review groups from the MDUFA 5 and MDUFA 4 reports can be aligned with data from the MDUFA 3 reports for corresponding review groups.
In other cases, the reorganizations took review groups that were included in the MDUFA 3 reports and divided up and separated their subgroups. This is essentially the case for OHT1, OHT3, and OHT4, meaning that MDUFA 5 and MDUFA 4 report data for those review groups cannot be aligned with MDUFA 3 report data.
In the case of OHT7, the reorganizations combined several review groups that already existed and were included in the MDUFA 3 reports into one larger group that is referenced in the MDUFA 4 and MDUFA 5 reports. This means that some data, such as the number of submissions received, can be summed across the corresponding groups in the MDUFA 3 reports to align the data with the larger organization that is included in the MDUFA 4 and MDUFA 5 reports. See, for example, Figure 1. In other cases, aligning the data is more complex. In still other cases, it is not possible to align the data. Other than submission volume in Figure 1, no additional efforts were made to align OHT7 data in the MDUFA 5 and MDUFA 4 reports to data from the MDUFA 3 reports for this post.
While I was not able to identify a reference that maps the review groups included in the MDUFA 3 reports to those used in the MDUFA 4 and MDUFA 5 reports, Table 1 shows how I mapped the groups for the purposes of this post based on the names of the old review groups and the names of the new review groups.
| MDUFA 3 report review group (Old) | Corresponding MDUFA 4 and MDUFA 5 report review group(s) (New) | Relationship between old and new review groups | MDUFA 3 data available in figures |
|---|---|---|---|
| DAGRID: Division of Anesthesiology, General Hospital, Respiratory, Infection Control, and Dental Devices | OHT1: Ophthalmic, Anesthesia, Respiratory, ENT, and Dental Devices OHT3: GastroRenal, ObGyn, General Hospital, and Urology Devices OHT4: Surgical and Infection Control Devices |
Old review group was split and is part of more than one new review group | No |
| DCD: Division of Cardiovascular Devices | OHT2: Cardiovascular Devices | Old review group and new review group are equivalent | Yes |
| DCTD: Division of Chemistry and Toxicology Devices | OHT7: In Vitro Diagnostics | Old review group is a subset of new review group | Only in Figure 1 |
| DIHD: Division of Immunology and Hematology Devices | OHT7: In Vitro Diagnostics | Old review group is a subset of new review group | Only in Figure 1 |
| DMD: Division of Microbiology Devices | OHT7: In Vitro Diagnostics | Old review group is a subset of new review group | Only in Figure 1 |
| DMGP: Division of Molecular Genetics and Pathology Devices | OHT7: In Vitro Diagnostics | Old review group is a subset of new review group | Only in Figure 1 |
| DNPMD: Division of Neurological and Physical Medicine Devices | OHT5: Neurological and Physical Medicine Devices | Old review group and new review group are equivalent | Yes |
| DOD: Division of Orthopedic Devices | OHT6: Orthopedic Devices | Old review group and new review group are equivalent | Yes |
| DOED: Division of Ophthalmic and Ear, Nose, and Throat Devices | OHT1: Ophthalmic, Anesthesia, Respiratory, ENT, and Dental Devices | Old review group was combined with parts of another old review group to form new review group | No |
| DRGUD: Division of Reproductive, Gastro-Renal, and Urological Devices | OHT3: GastroRenal, ObGyn, General Hospital, and Urology Devices | Old review group was combined with part of another old review group to form new review group | No |
| DRH: Division of Radiological Health | OHT8: Radiological Health | Old review group and new review group are equivalent | Yes |
| DSD: Division of Surgical Devices | OHT4: Surgical and Infection Control Devices | Old review group was combined with part of another old review group to form new review group | No |
The COVID-19 Public Health Emergency impacted these datasets
A Public Health Emergency (PHE) was declared for COVID-19 beginning on 2020-01-27 (FY 2020 Q2) and was renewed until it expired on 2023-05-11 (FY 2023 Q3). Responding to the PHE had a major impact on the FDA’s work. Other related declarations and determinations also impacted and continue to impact the FDA’s work. To acknowledge the impact of the PHE on the FDA’s work, graphs in this post that plot metrics over time also show the PHE as a shaded region underlaying data points associated with FY 2020 through FY 2023.
Exemptions impacted these datasets
The FDA exempts lower risk and well characterized types of medical devices from 510(k) review from time to time. Examples include a large round of exemptions that occurred in 2017 and smaller rounds of exemptions in 2018 and 2020. [8] [9] [10]
Exemptions can decrease the volume of 510(k)s that a review group receives. 510(k)s for medical devices that are not exempted and remain in the 510(k) program may include more complex or less well-characterized technologies that are more challenging to review. The review process for these 510(k)s may take more time on average, and this may affect performance metrics over time.
These datasets focus on efficiency, not quality
The performance metrics in the MDUFA reports primarily focus on how long things take. Information about interim and final submission outcomes – such as the rate at which 510(k)s result in requests for additional information and the rate at which 510(k)s result in a medical device being cleared for market in the United States – are also included. More comprehensive information about submission and review quality, meaning how good a job applicants do in preparing submissions and how good a job the FDA does in reviewing them, is not included in the MDUFA reports or this post.
To provide the public with some additional insight into quality and other topics, the MDUFA commitments have included “independent assessments” by a government contractor. The most recent one resulted in a report published in 2021. [11] Historically, the FDA and the GAO have also performed assessments. [12] [6]
Therefore, efficiency metrics associated with the amount of time submissions spend going through the FDA review process, especially when well-established submission and review quality metrics are not readily available, provide an incomplete picture of the FDA’s medical device review programs. In addition, differences in submission or review quality over time or across product areas may affect these metrics.
510(k) program metrics
The FDA provides visualizations of many 510(k) program performance metrics for the Center for Devices and Radiological Health (CDRH) as a whole, but the FDA does not provide these for review groups within CDRH. [3, pp. 102–111] This post provides visualizations for OHT1 through OHT8.
Submission volume
The MDUFA reports include information about submissions received over time. This can be plotted, and future submission volume can be projected. The projections provided here are somewhat naive: They are linear models based on fiscal year and review organization. This means that, for example, the OHT4 projections do not account for any impact that the end of the PHE may have on submission volume, and the OHT7 projections do not account for any impact that the FDA’s proposed rule on Laboratory Developed Tests or Procedures may have on submission volume.

Cohort closure percentage
See this section above for a discussion of what it means for a receipt cohort to be open or closed. As expected, Figure 2 shows that the FY 2023 510(k) receipt cohort had many open 510(k)s as of the most recent MDUFA performance report, meaning that performance metrics calculated on that cohort and shown in the figures throughout this post are likely to change substantially in future reports.
FDA Days metrics
The MDUFA performance reports include summary statistics about how long reviews take across the population of 510(k)s received. In particular, the reports provide quintiles (the 20th, 40th, 60th, and 80th percentiles) of FDA Days, Industry Days, and Total Days. Quintiles are an unusual choice for summary statistics about a distribution, and I’m not aware of a standard approach to plotting them. They can’t be plotted with boxplots, for example, which use quartiles. The visualizations in this post are inspired by boxplots though: They use line segments to show the percentile metrics and points to show averages.
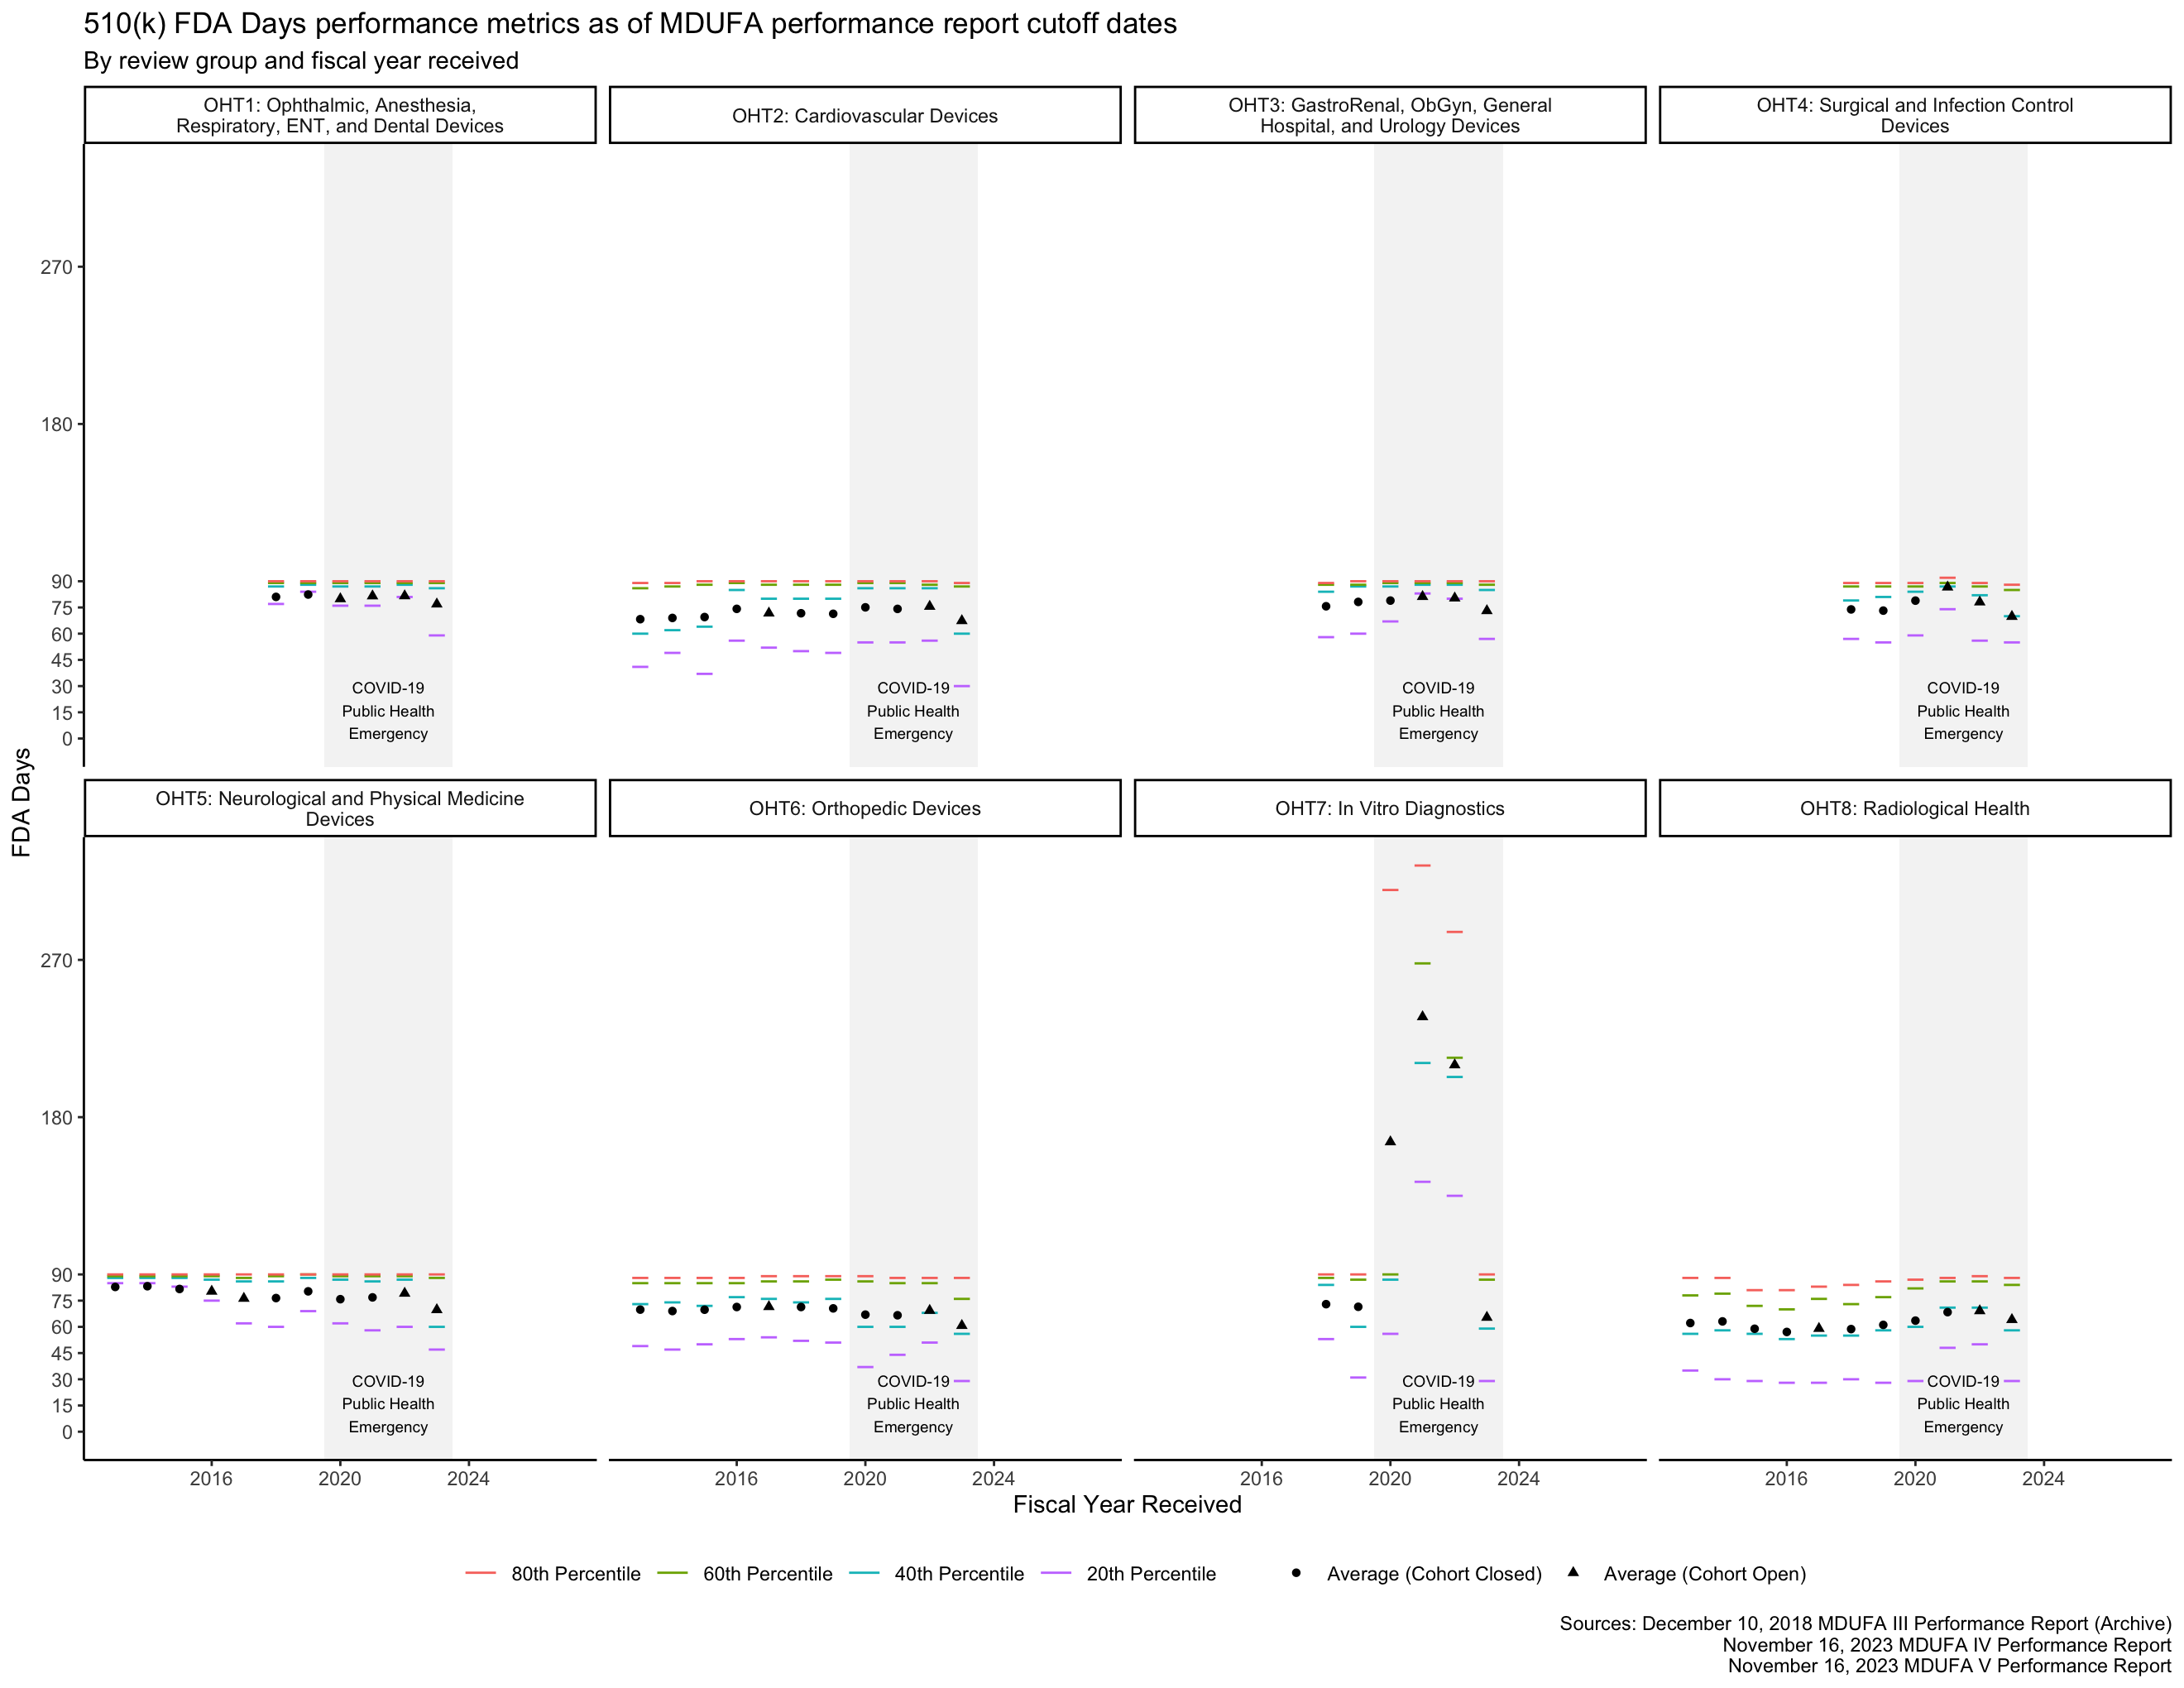
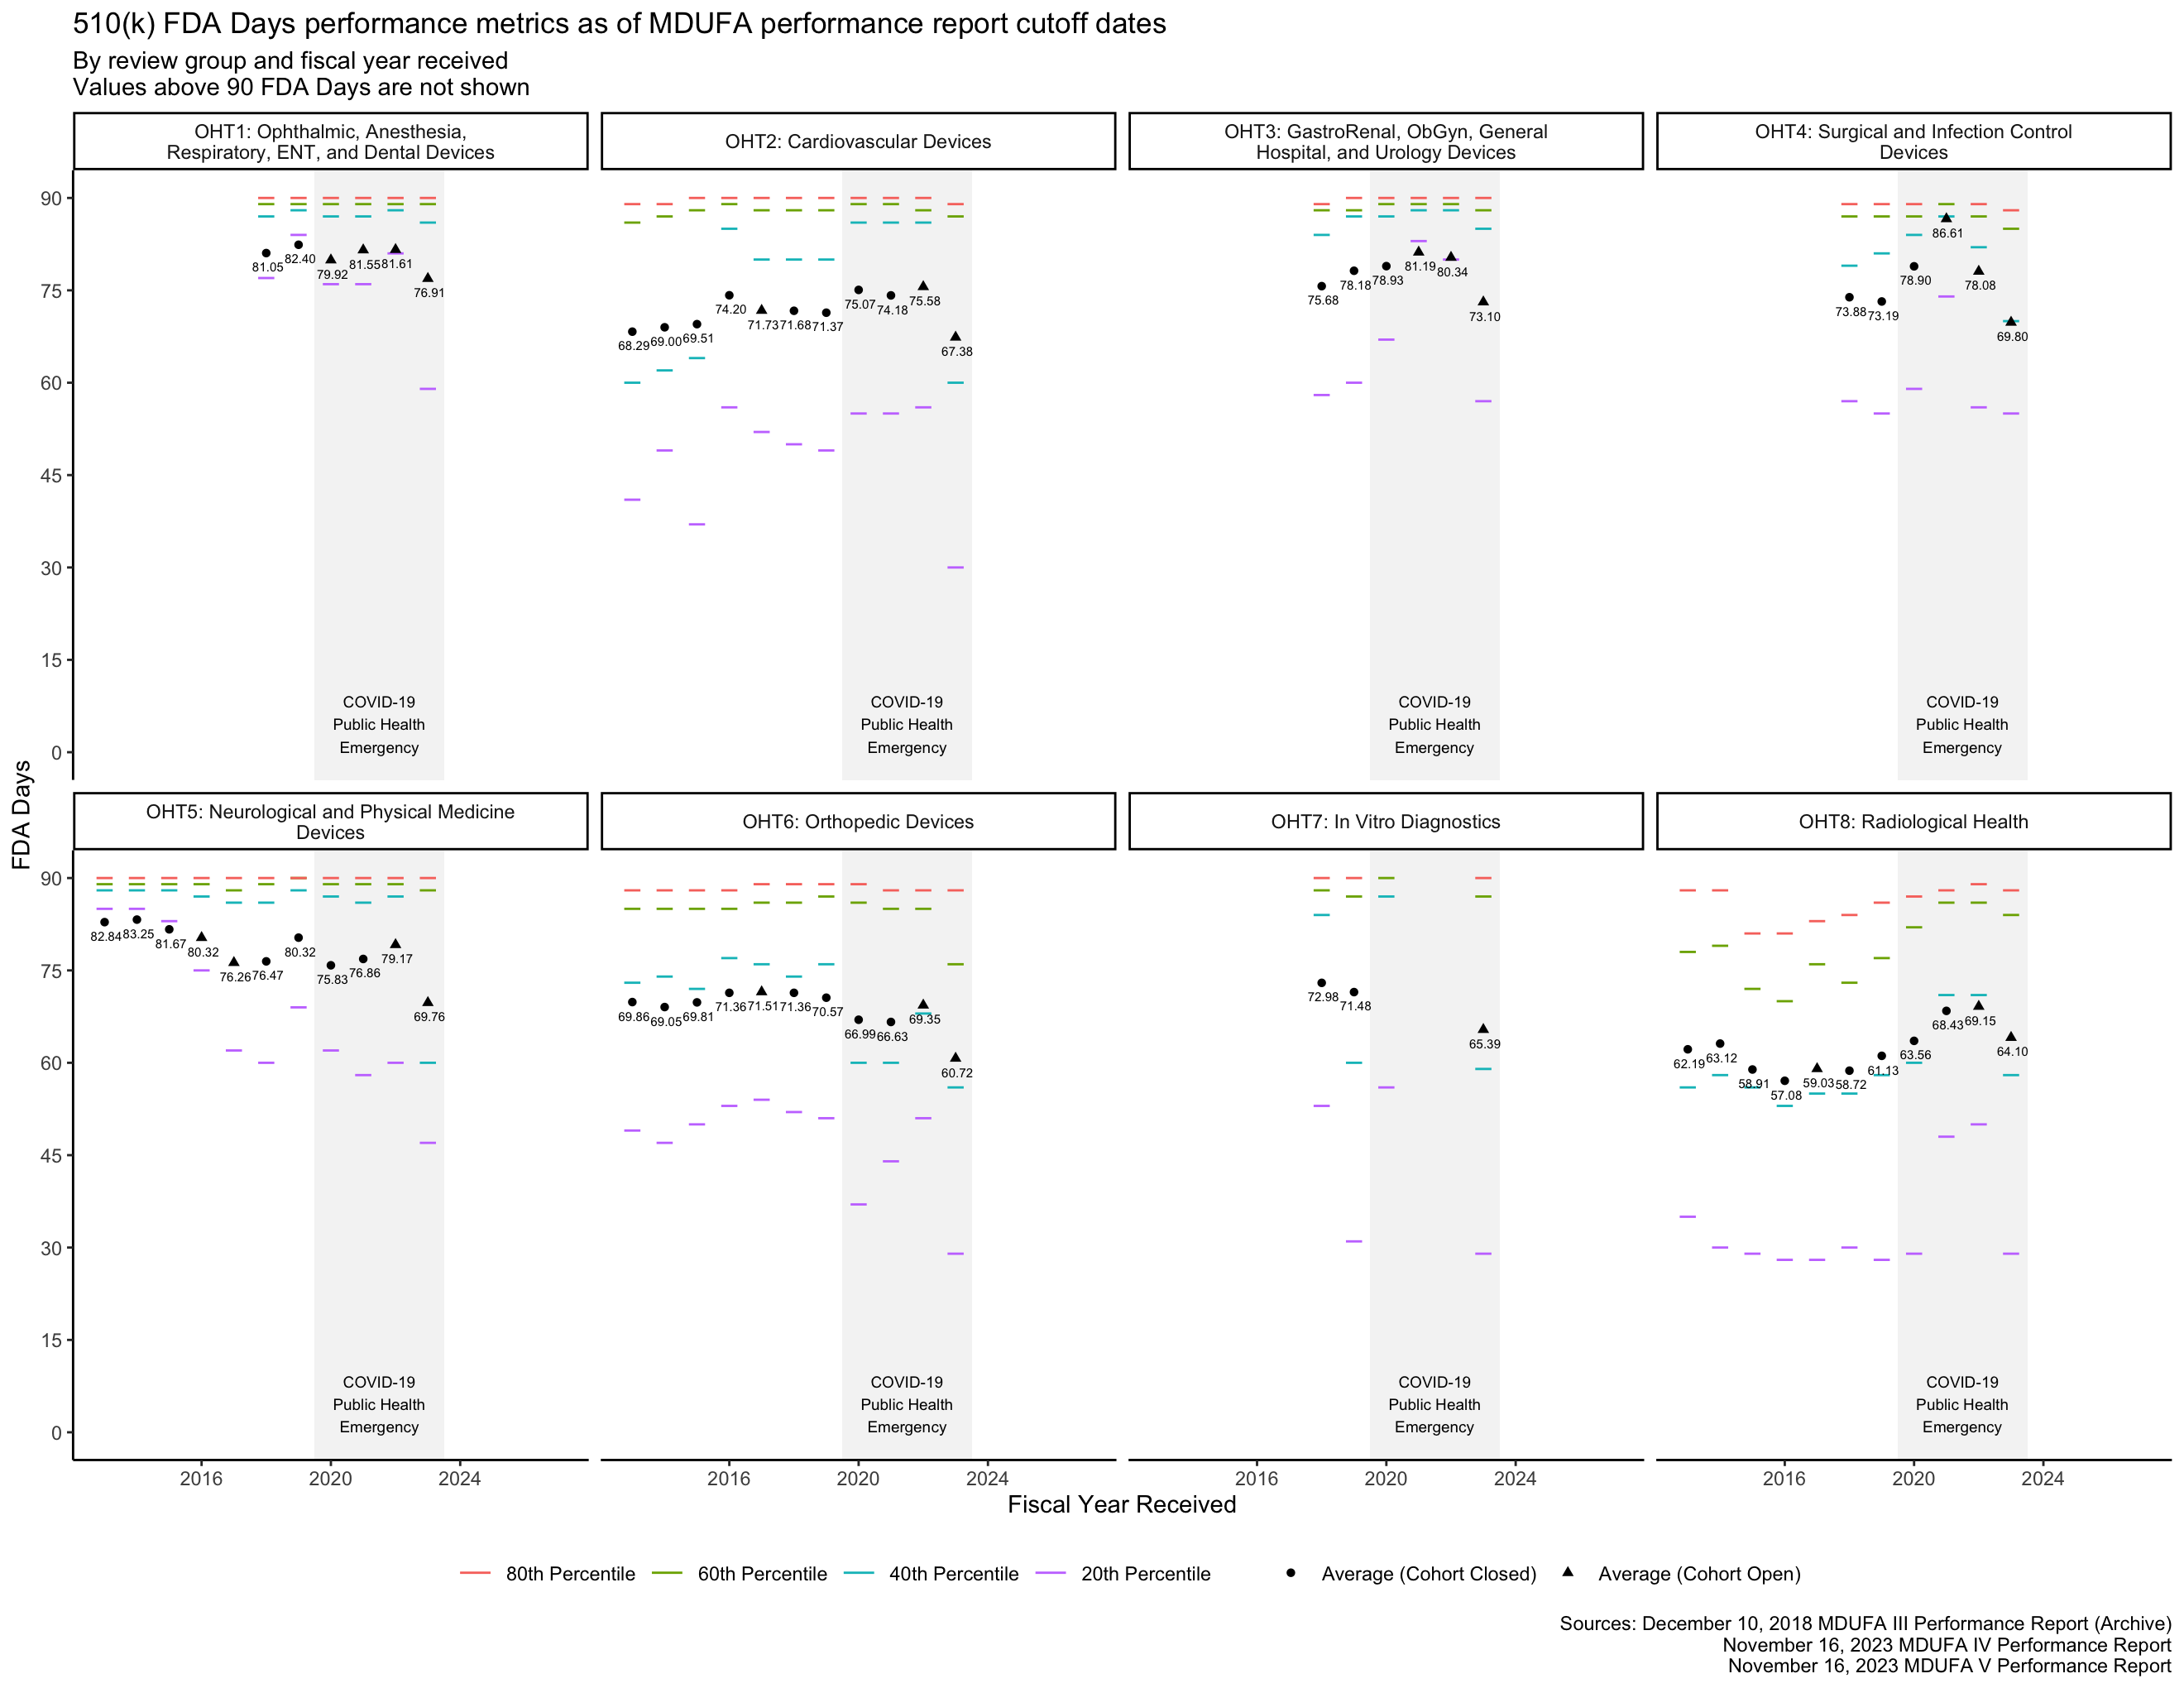
The PHE had a major impact on the data in Figure 3 for OHT7. Figure 4 shows the same data within 0 through 90 FDA Days, making it easier to see the data associated with OHTs 1-6 and 8.
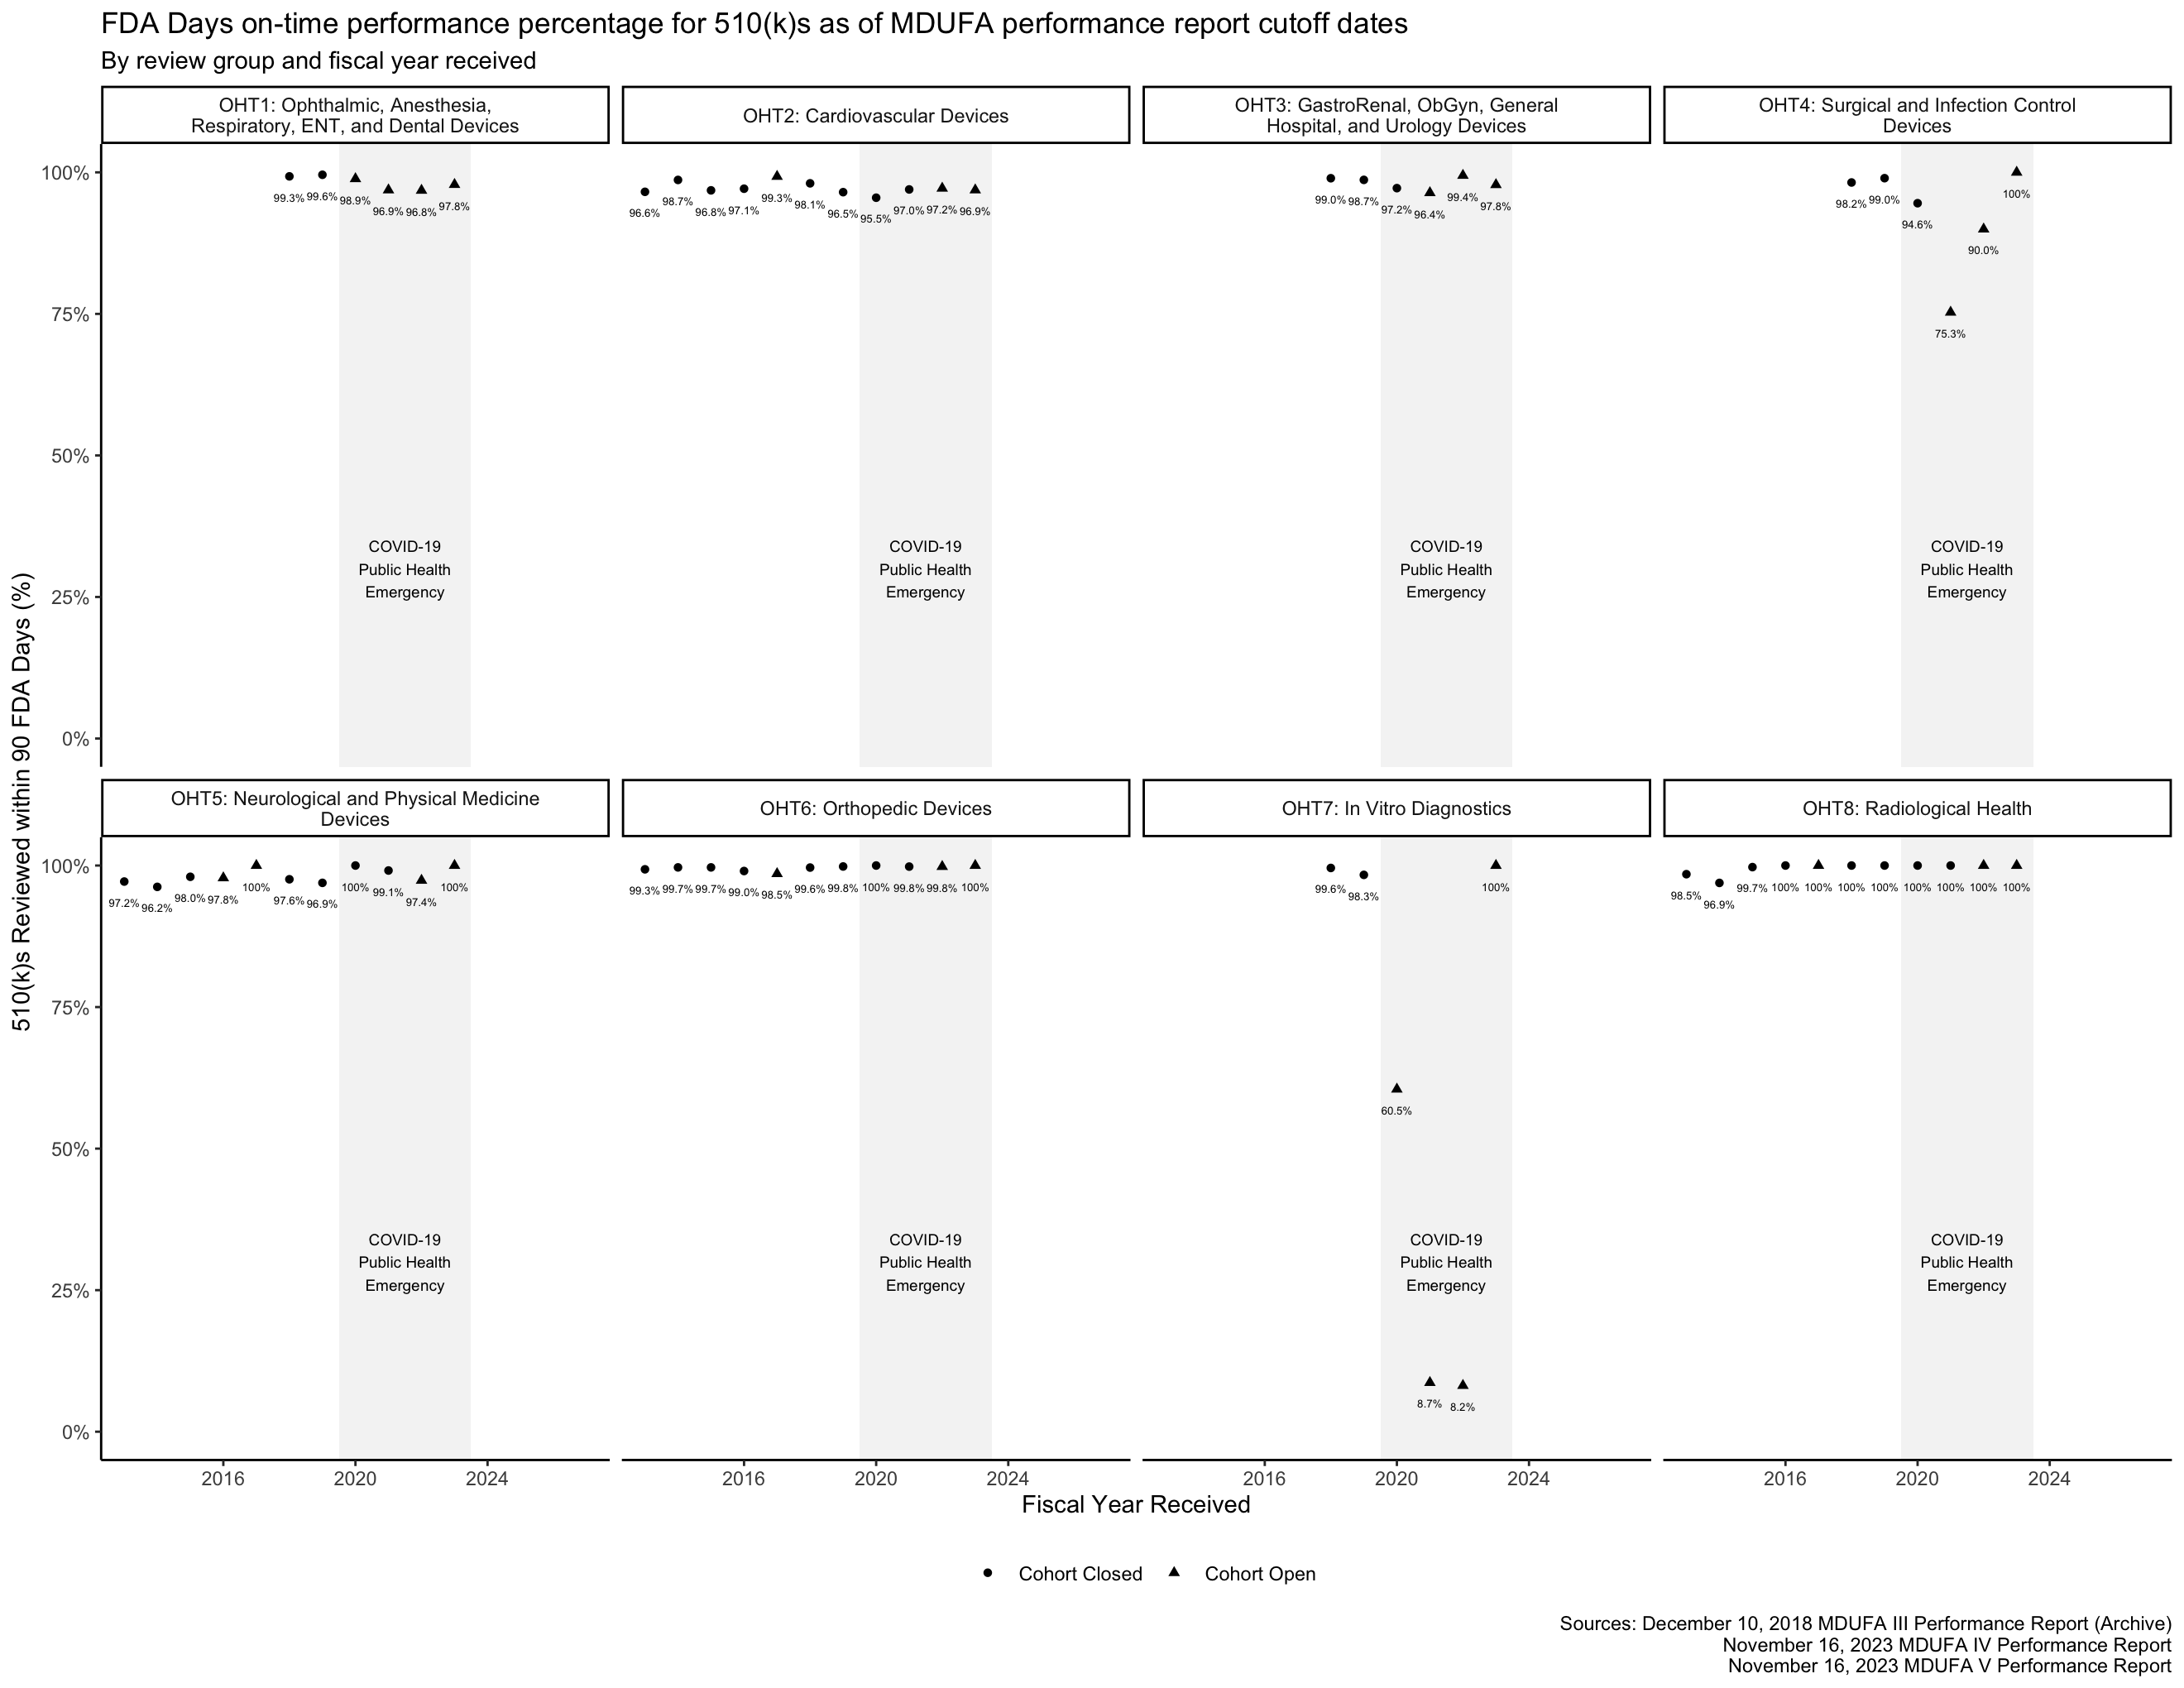
FDA Days on-time performance
The FDA has 90 FDA Days to review a 510(k).4 The percentage of 510(k)s reviewed within this time frame can be thought of as “on-time performance,” similar to how the metric is used in transportation. The MDUFA reports include on-time performance metrics for the 510(k) program, shown in Figure 5.
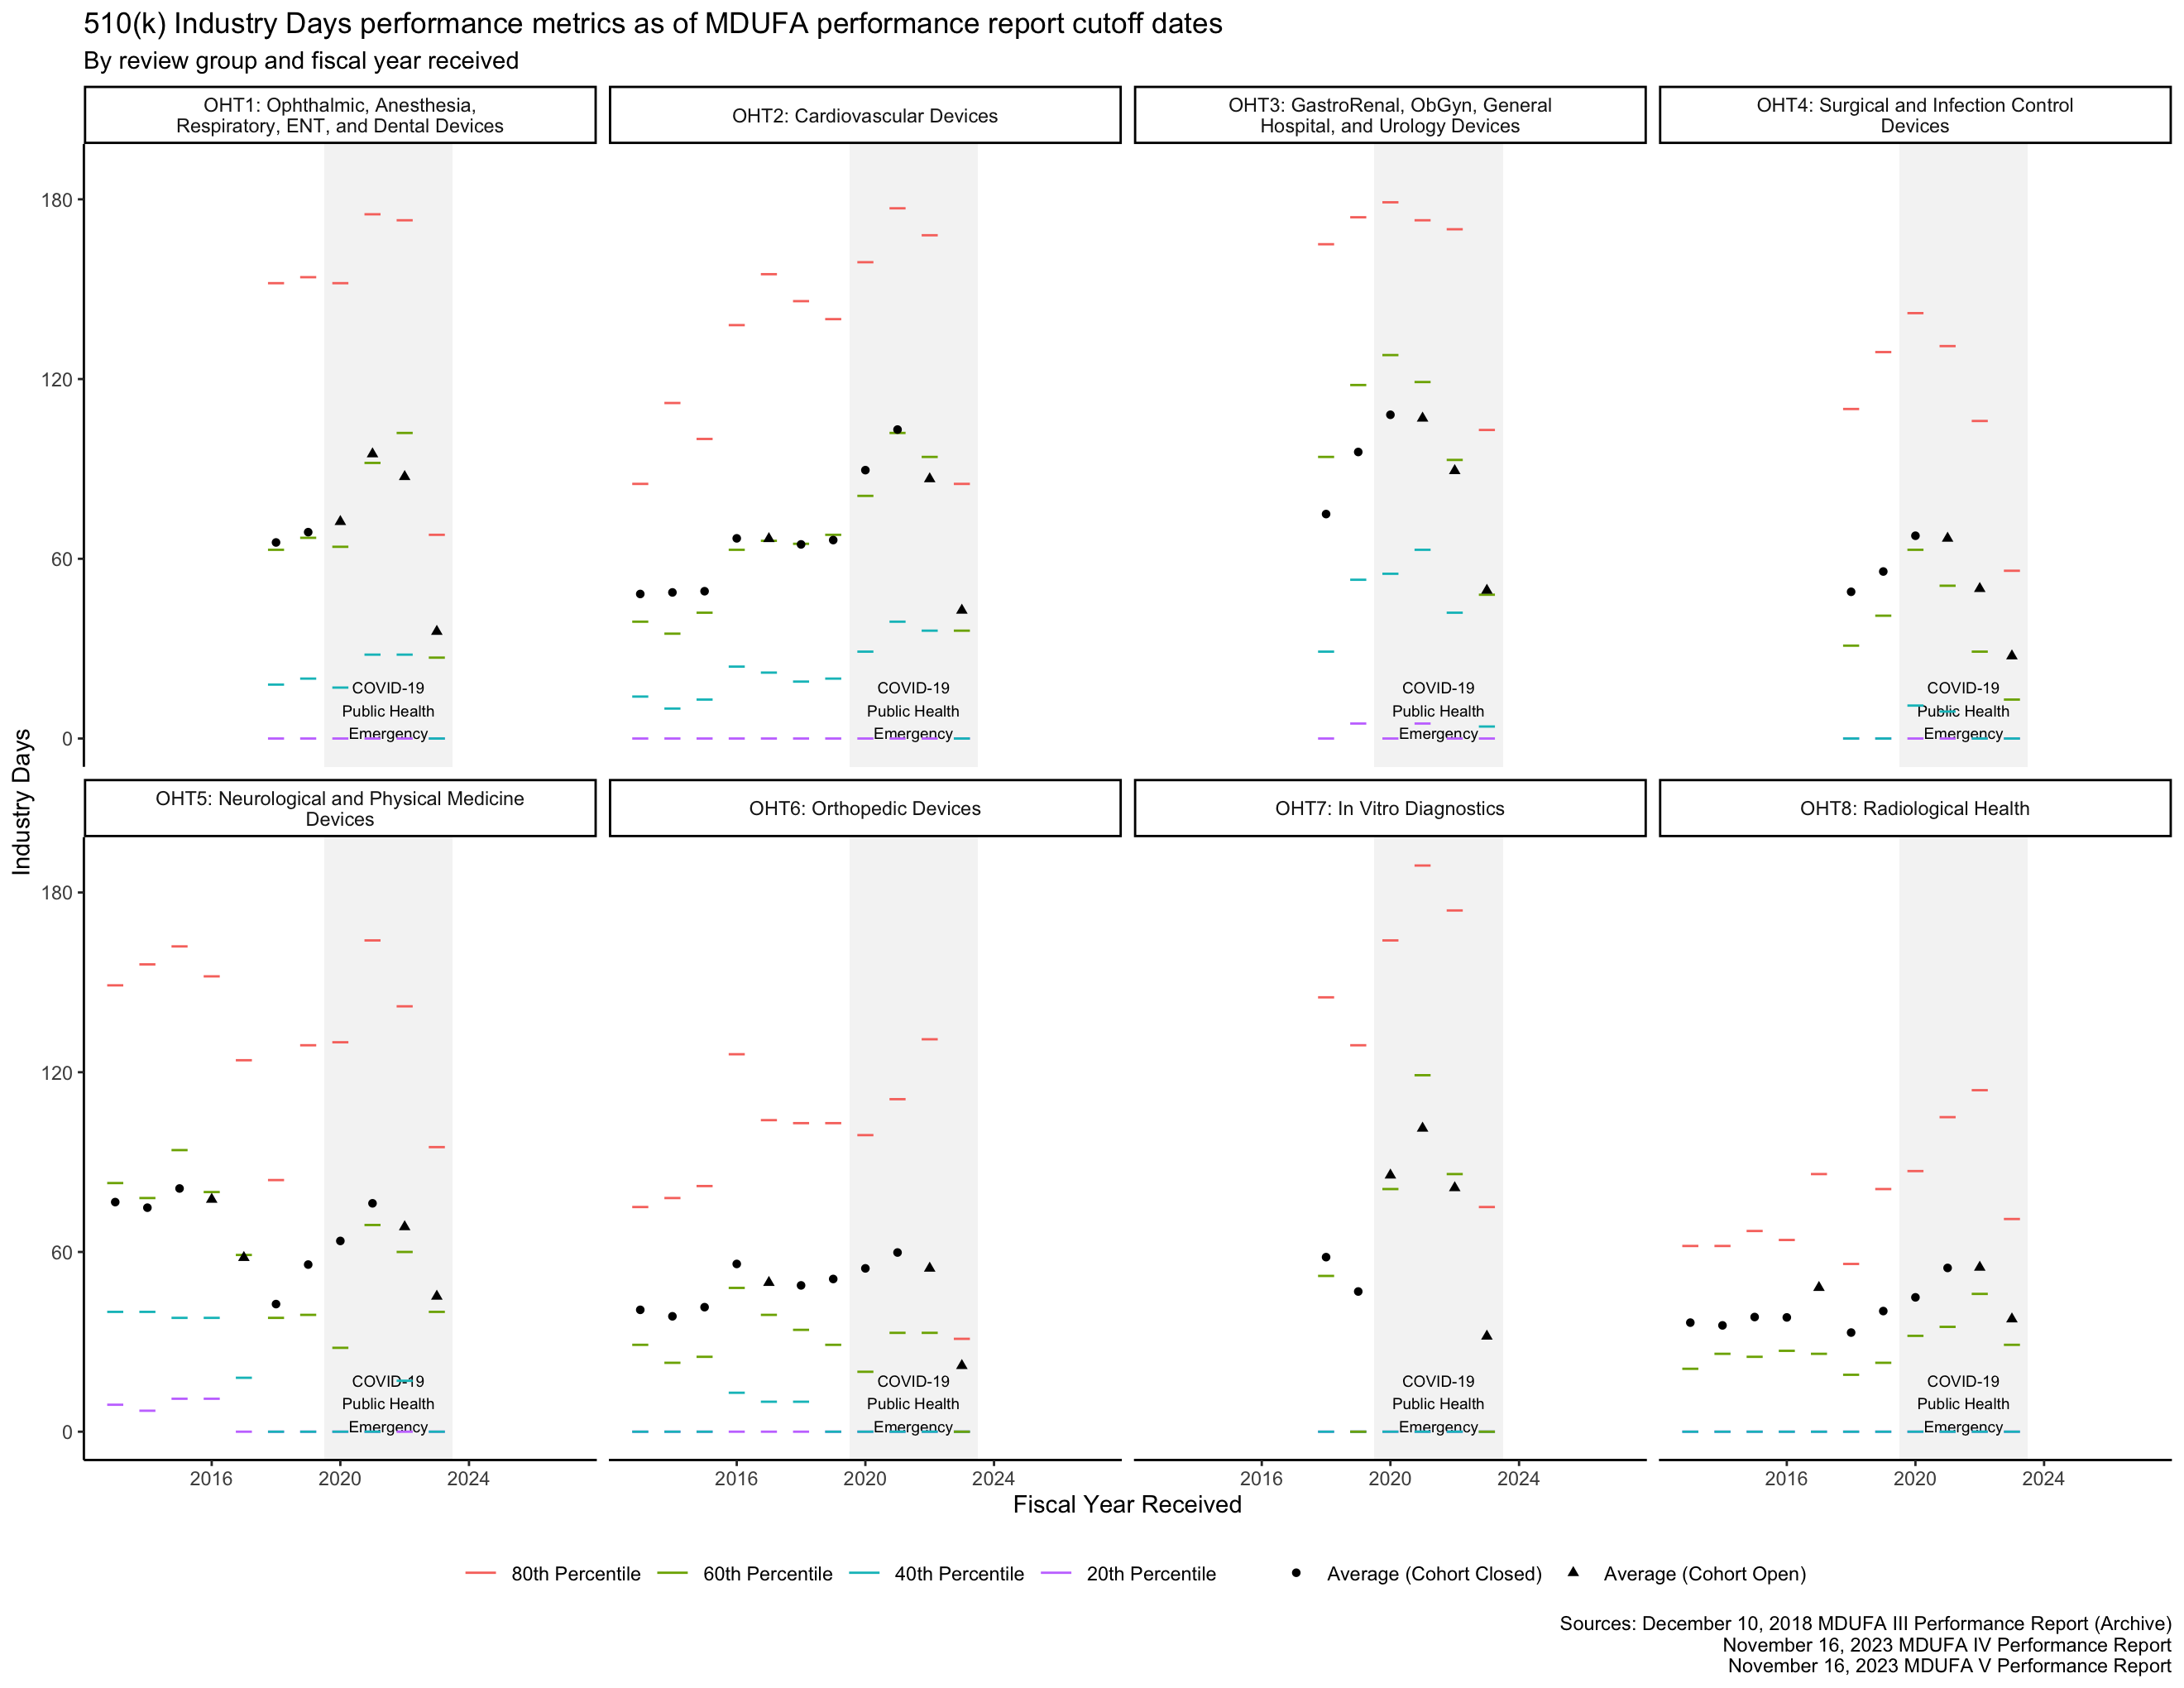
Industry Days metrics
By regulation, applicants have 30 days to respond to a request for additional information from the FDA before the FDA may consider a 510(k) to have been “withdrawn” by the applicant.5 By policy, the FDA allows up to 180 days for an applicant to respond. [13, p. 9] Figure 6 provides information about how long these responses have taken by fiscal year and by the FDA review group with which an applicant is interacting.
Total Days metrics
As described above, the FDA has 90 FDA Days to review a 510(k), and applicants have 180 Industry Days to respond to questions the FDA raises in the course of that review. This means that the total amount of time available for a 510(k) to go through the review process if these activities are completed on time is 270 Total Days. Figure 7 and Figure 8 show how long the process has taken by fiscal year and by FDA review group.
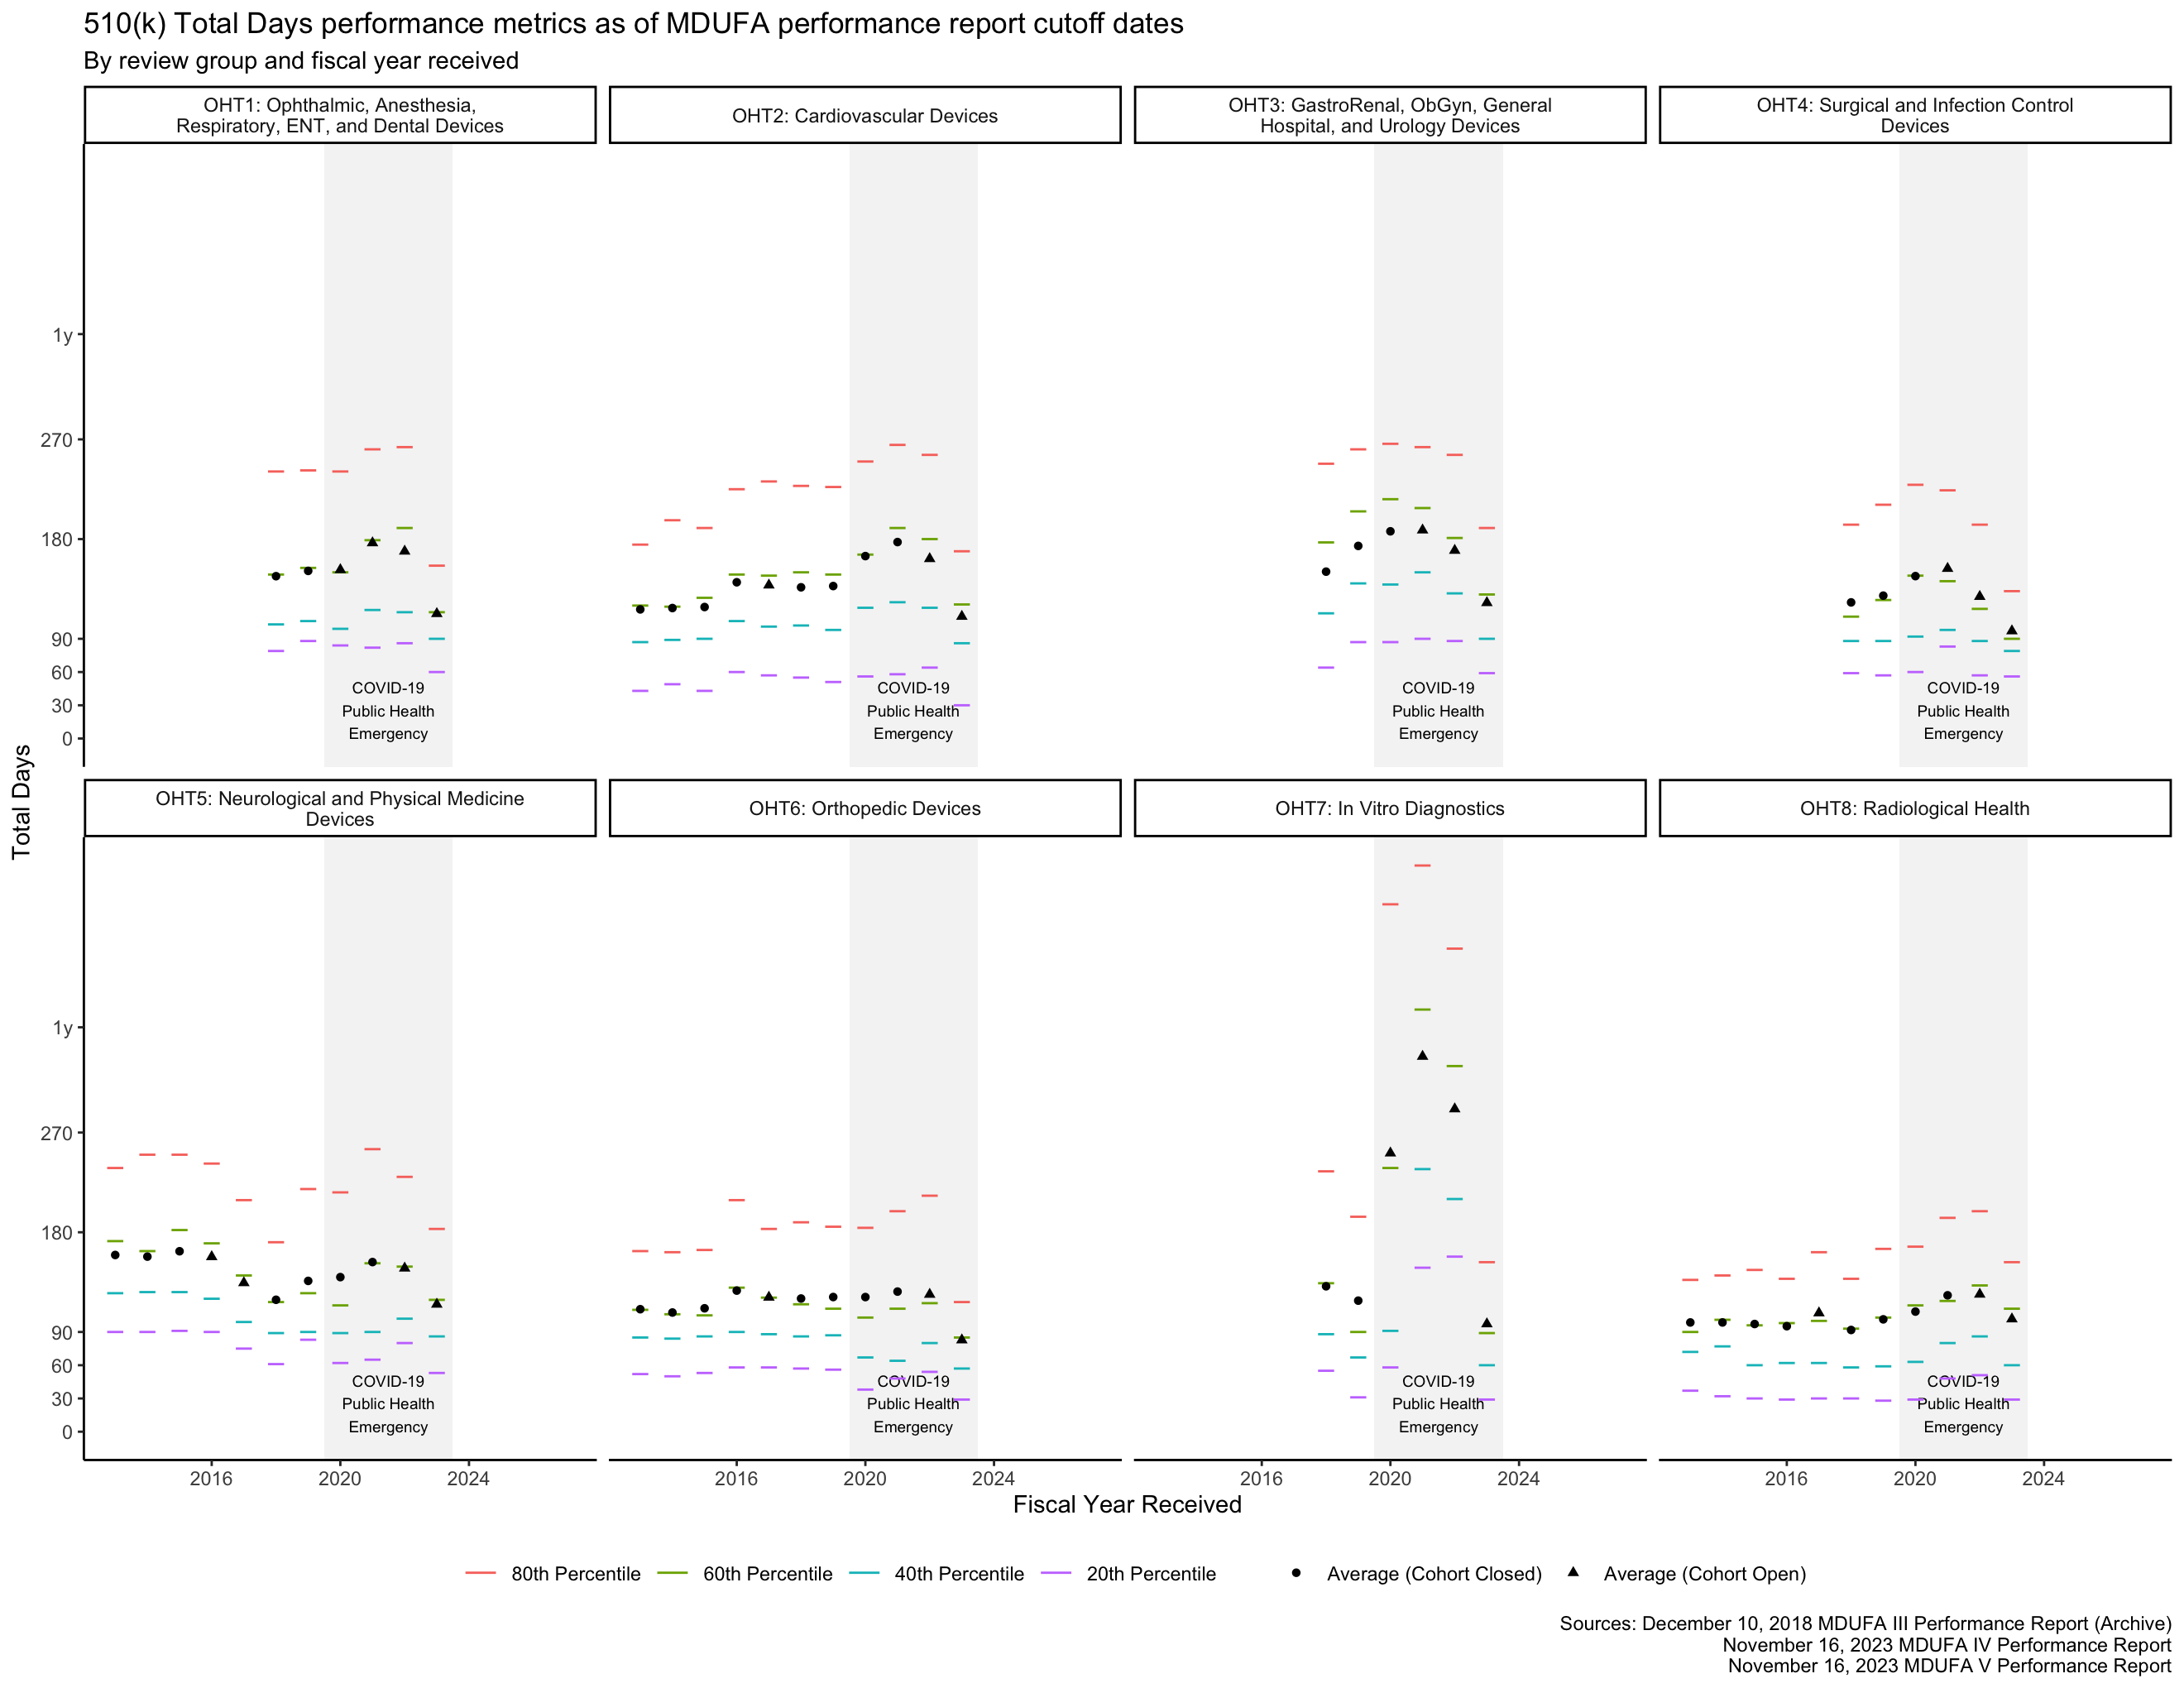
The PHE had a major impact on the data in Figure 7 for OHT7. Figure 8 shows the same data within 0 through 270 Total Days, making it easier to see the data associated with OHTs 1-6 and 8.

Review cycle metrics
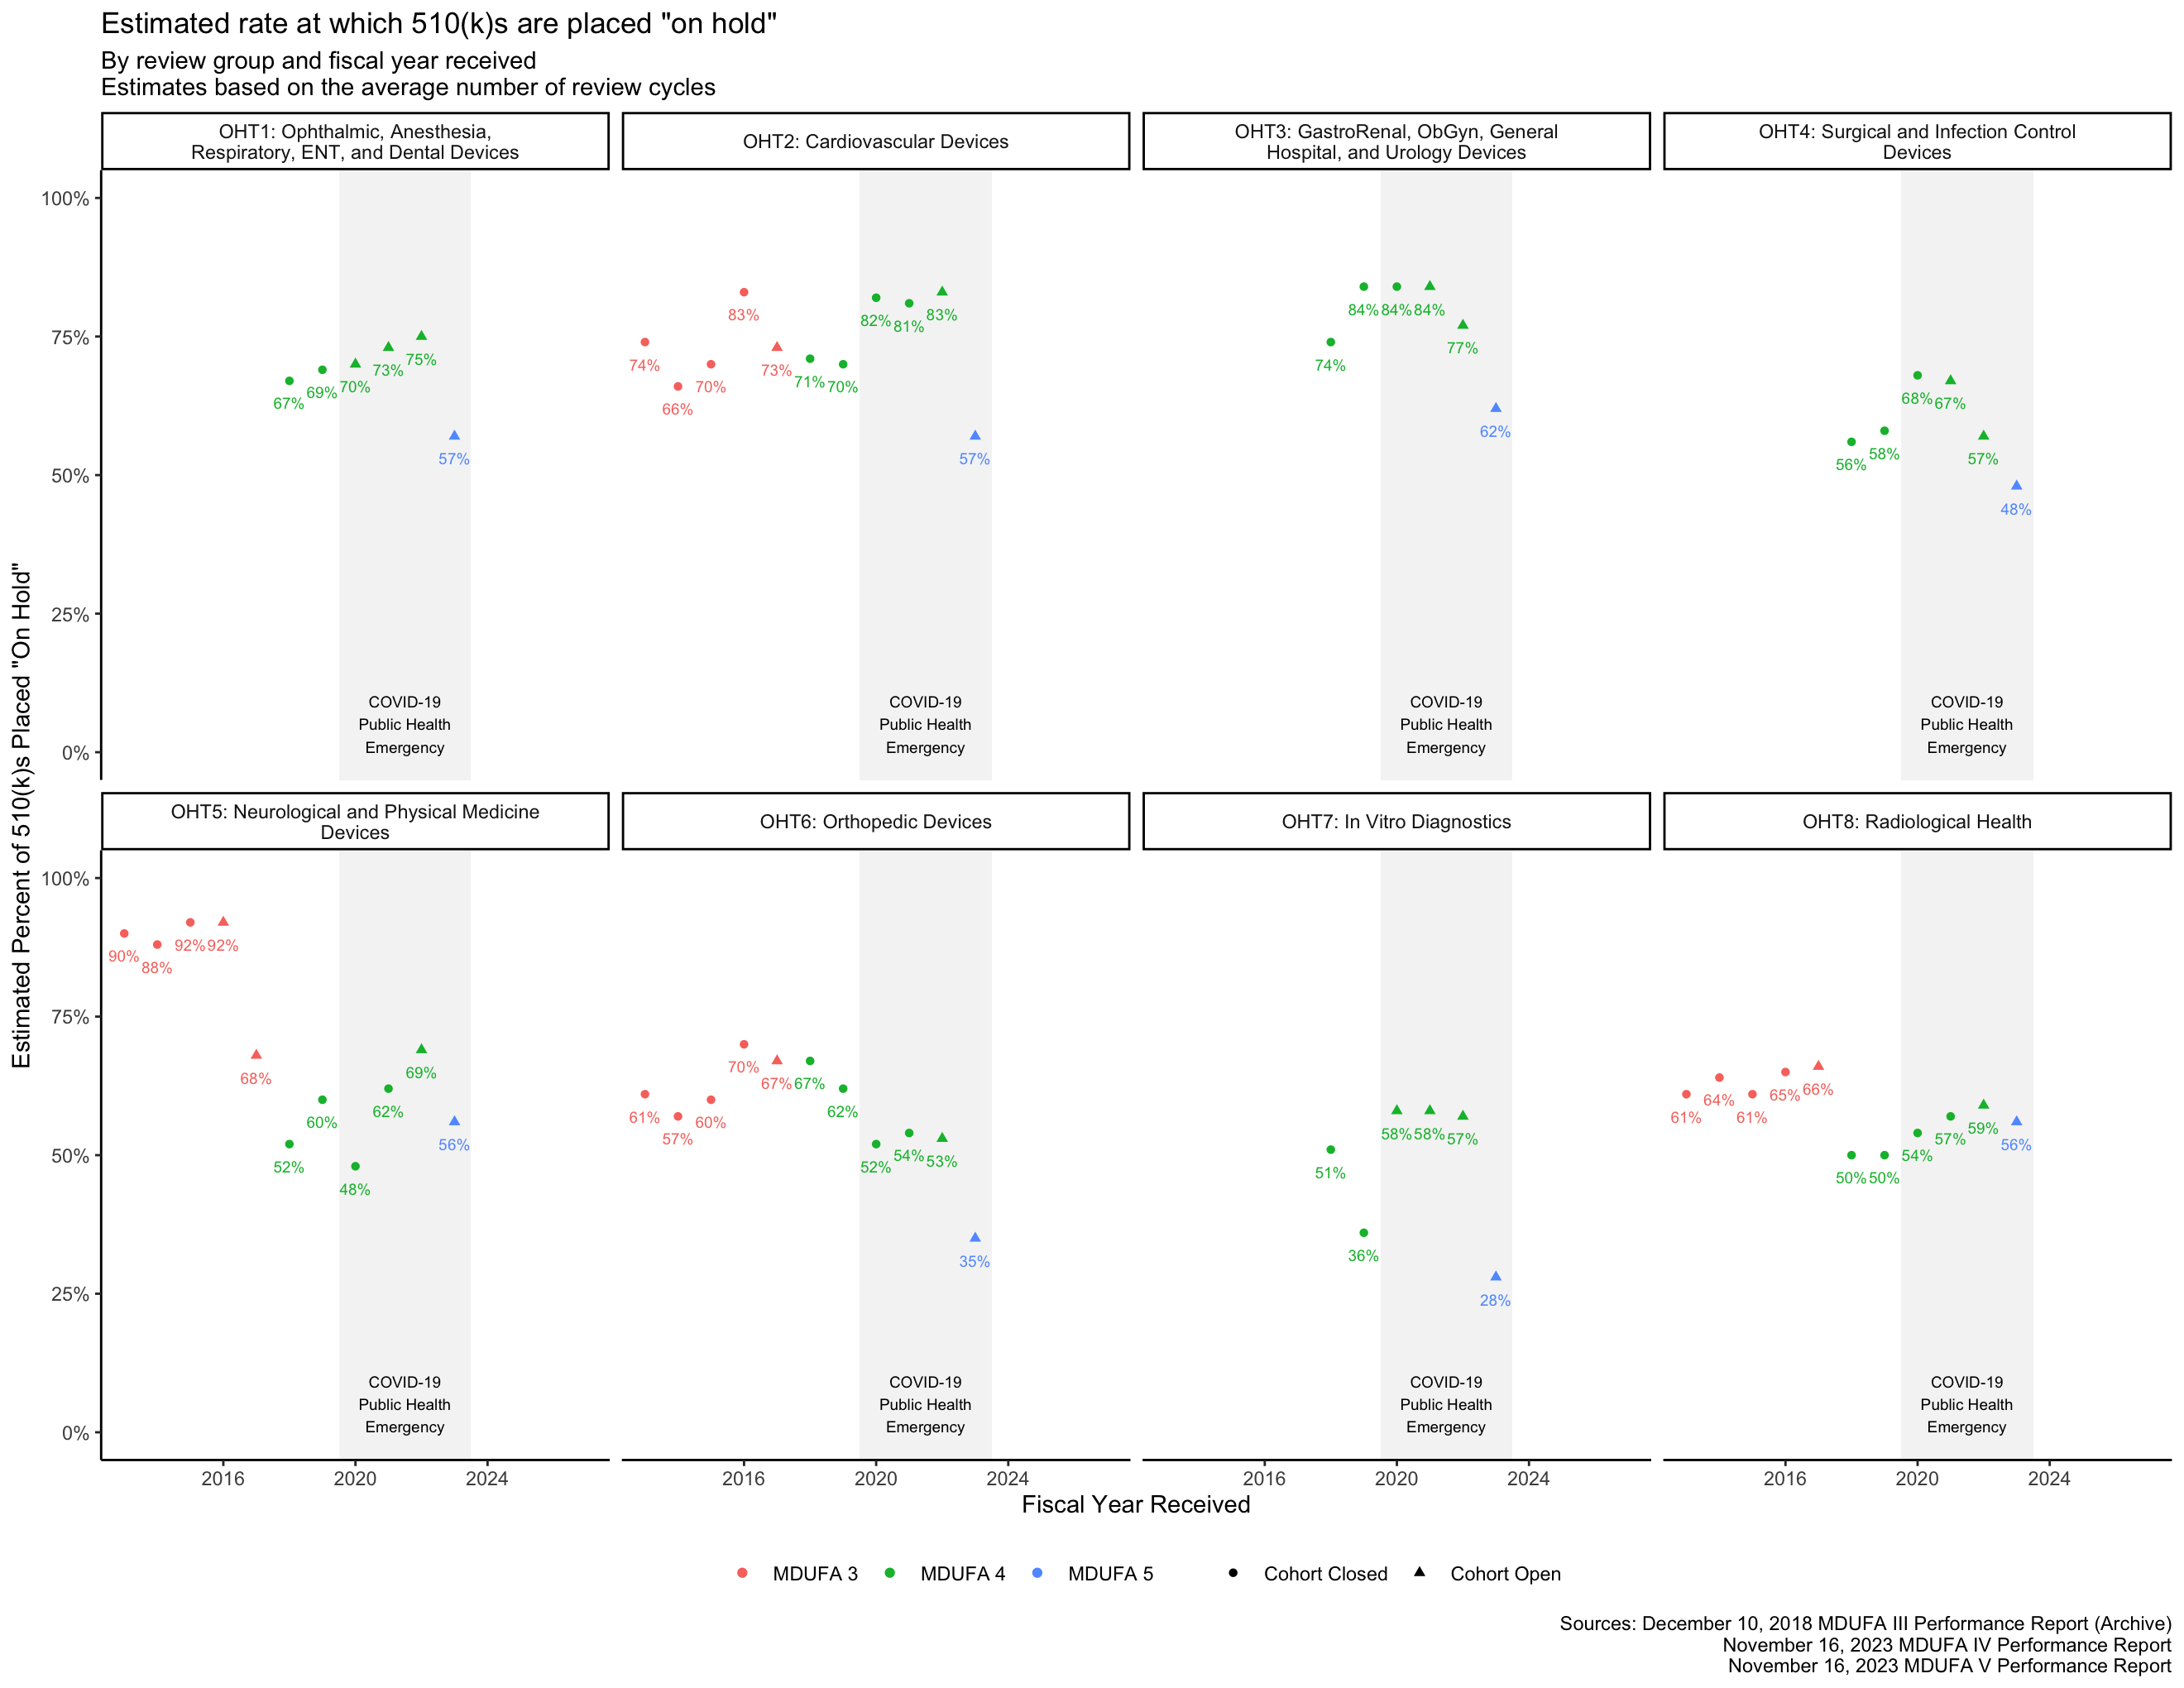
The FDA reports the average number of review cycles for 510(k)s, which is related to the rate at which the FDA places 510(k)s “on hold” to request additional information from applicants.
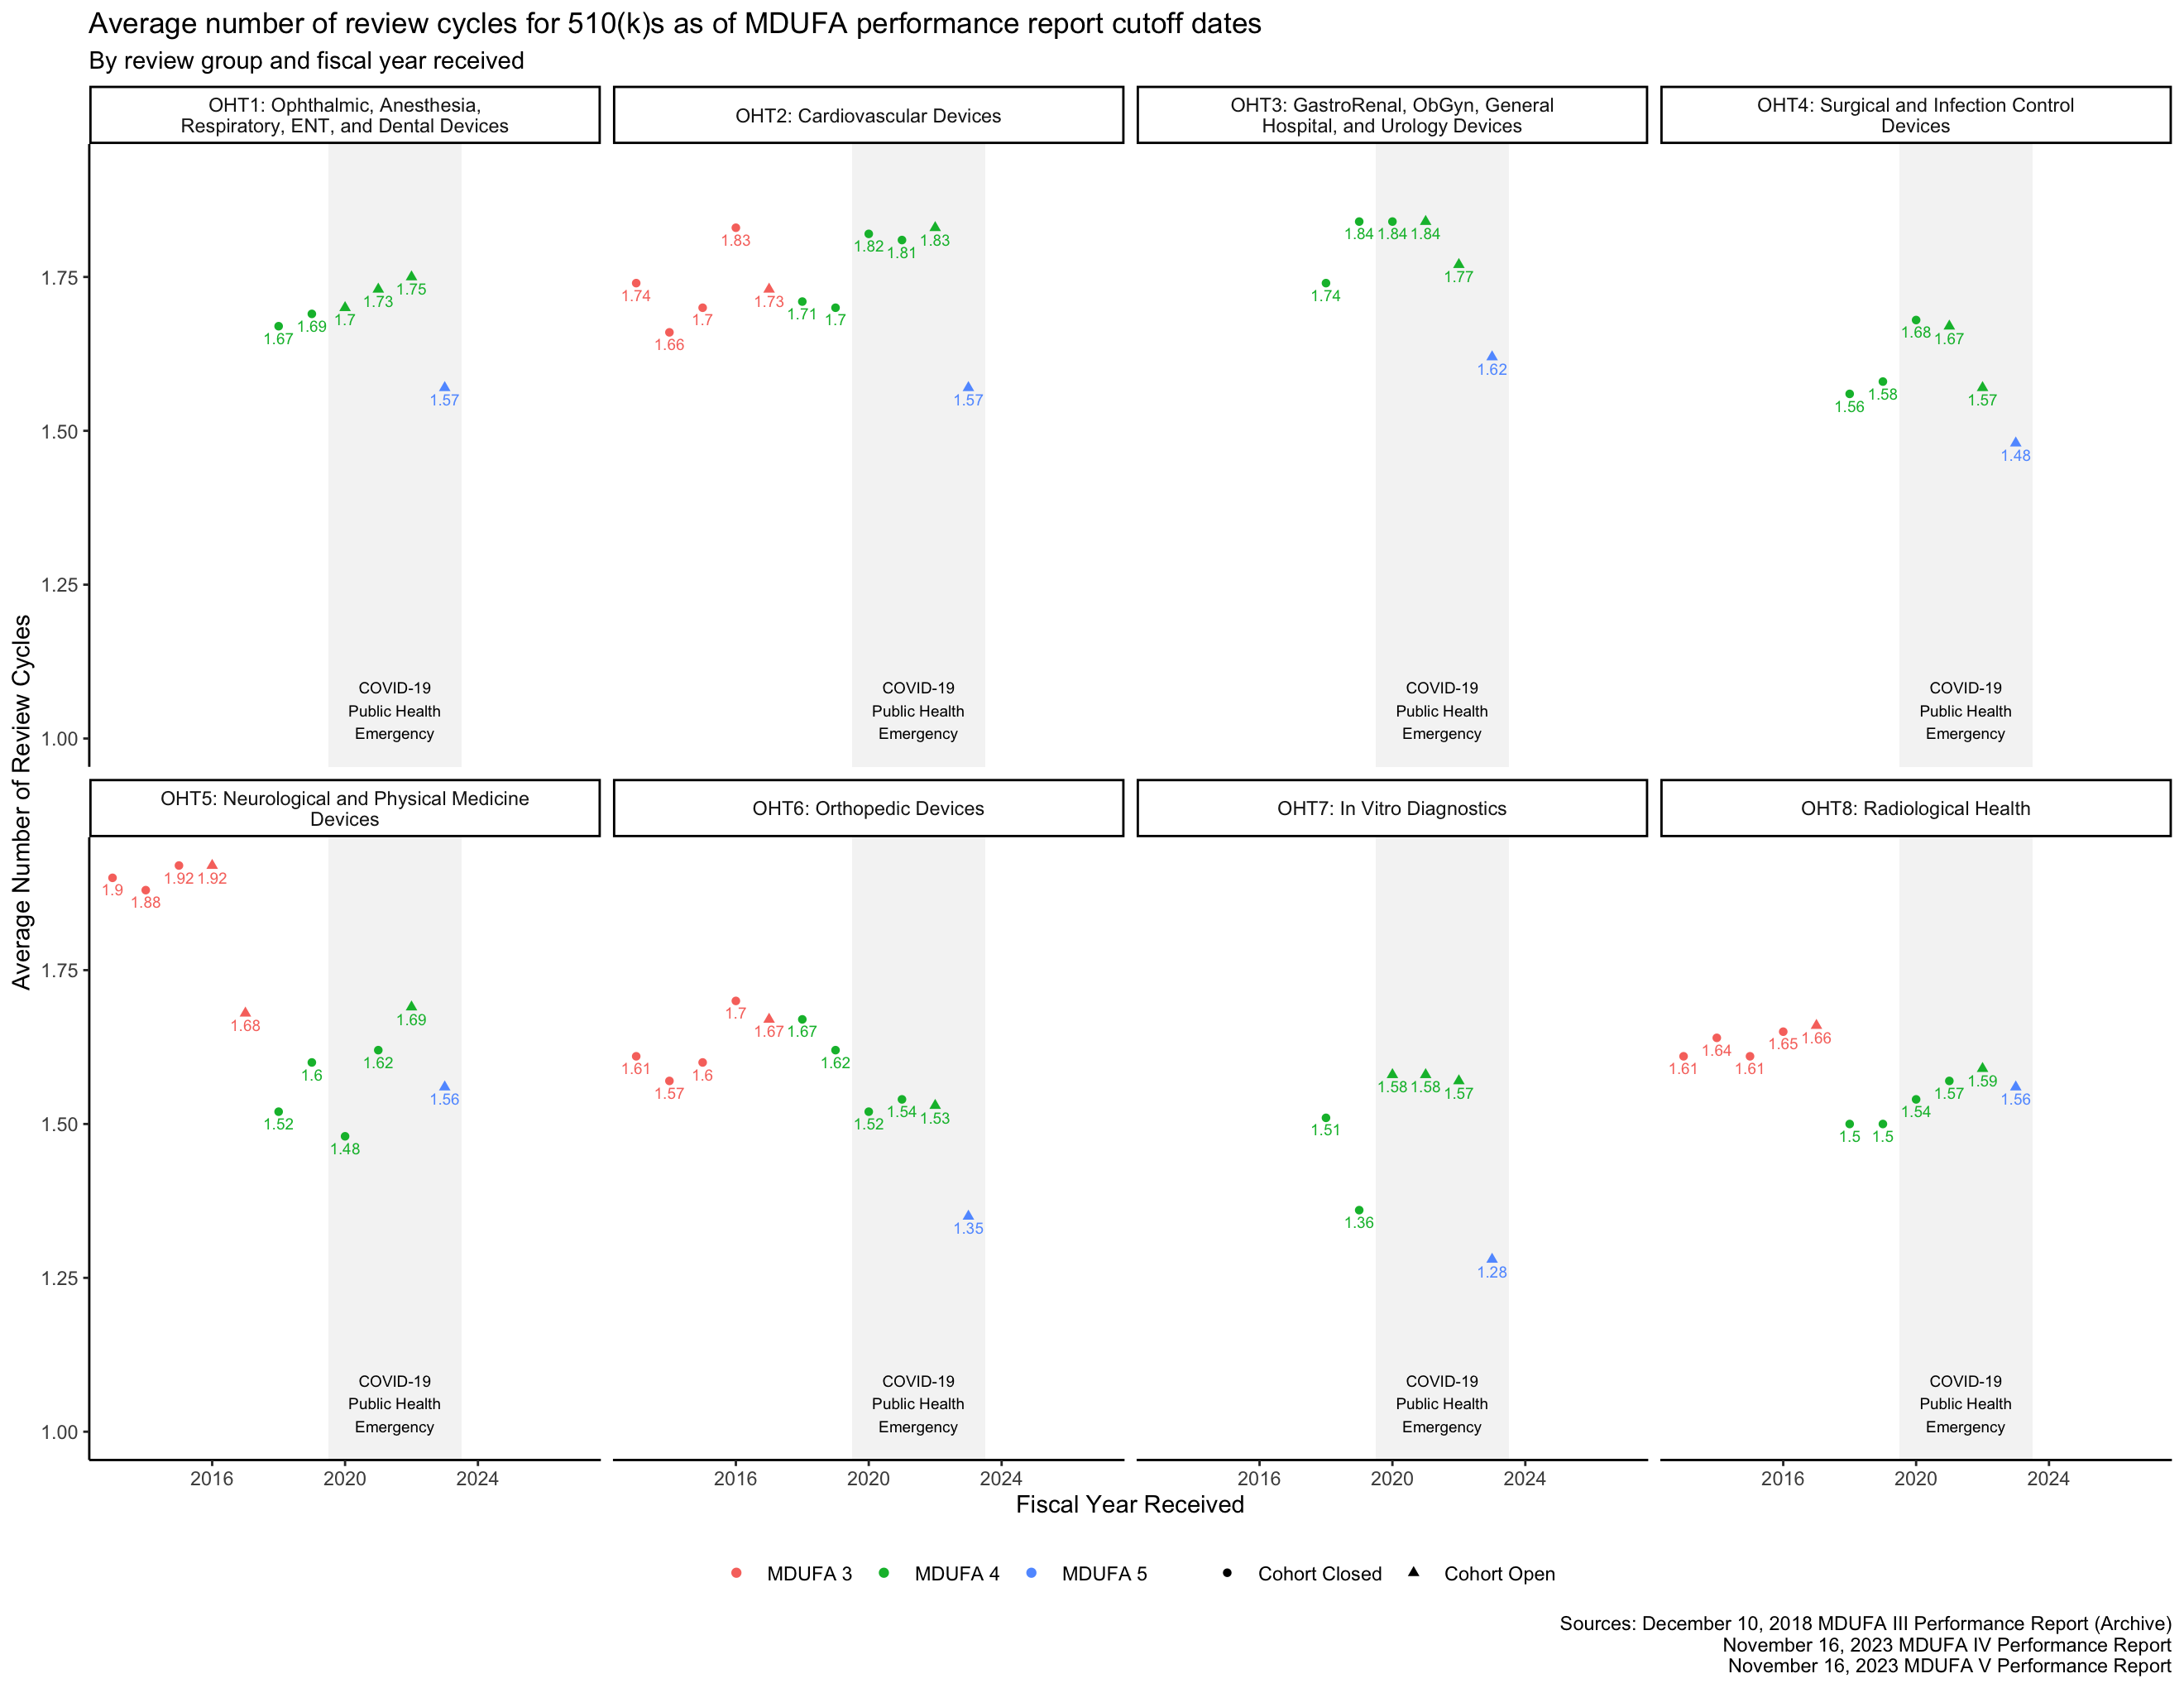
While the FDA occasionally places a single 510(k) on hold more than once, this has been uncommon since at least 2014. [14, p. 8] It is not quite correct to assume that 510(k)s cannot have more than 2 review cycles, but it is a useful approximation for the purpose of estimating the rate at which the FDA places 510(k)s “on hold” to request additional information. With this assumption, that proportion is the Average Number of Review Cycles minus one.
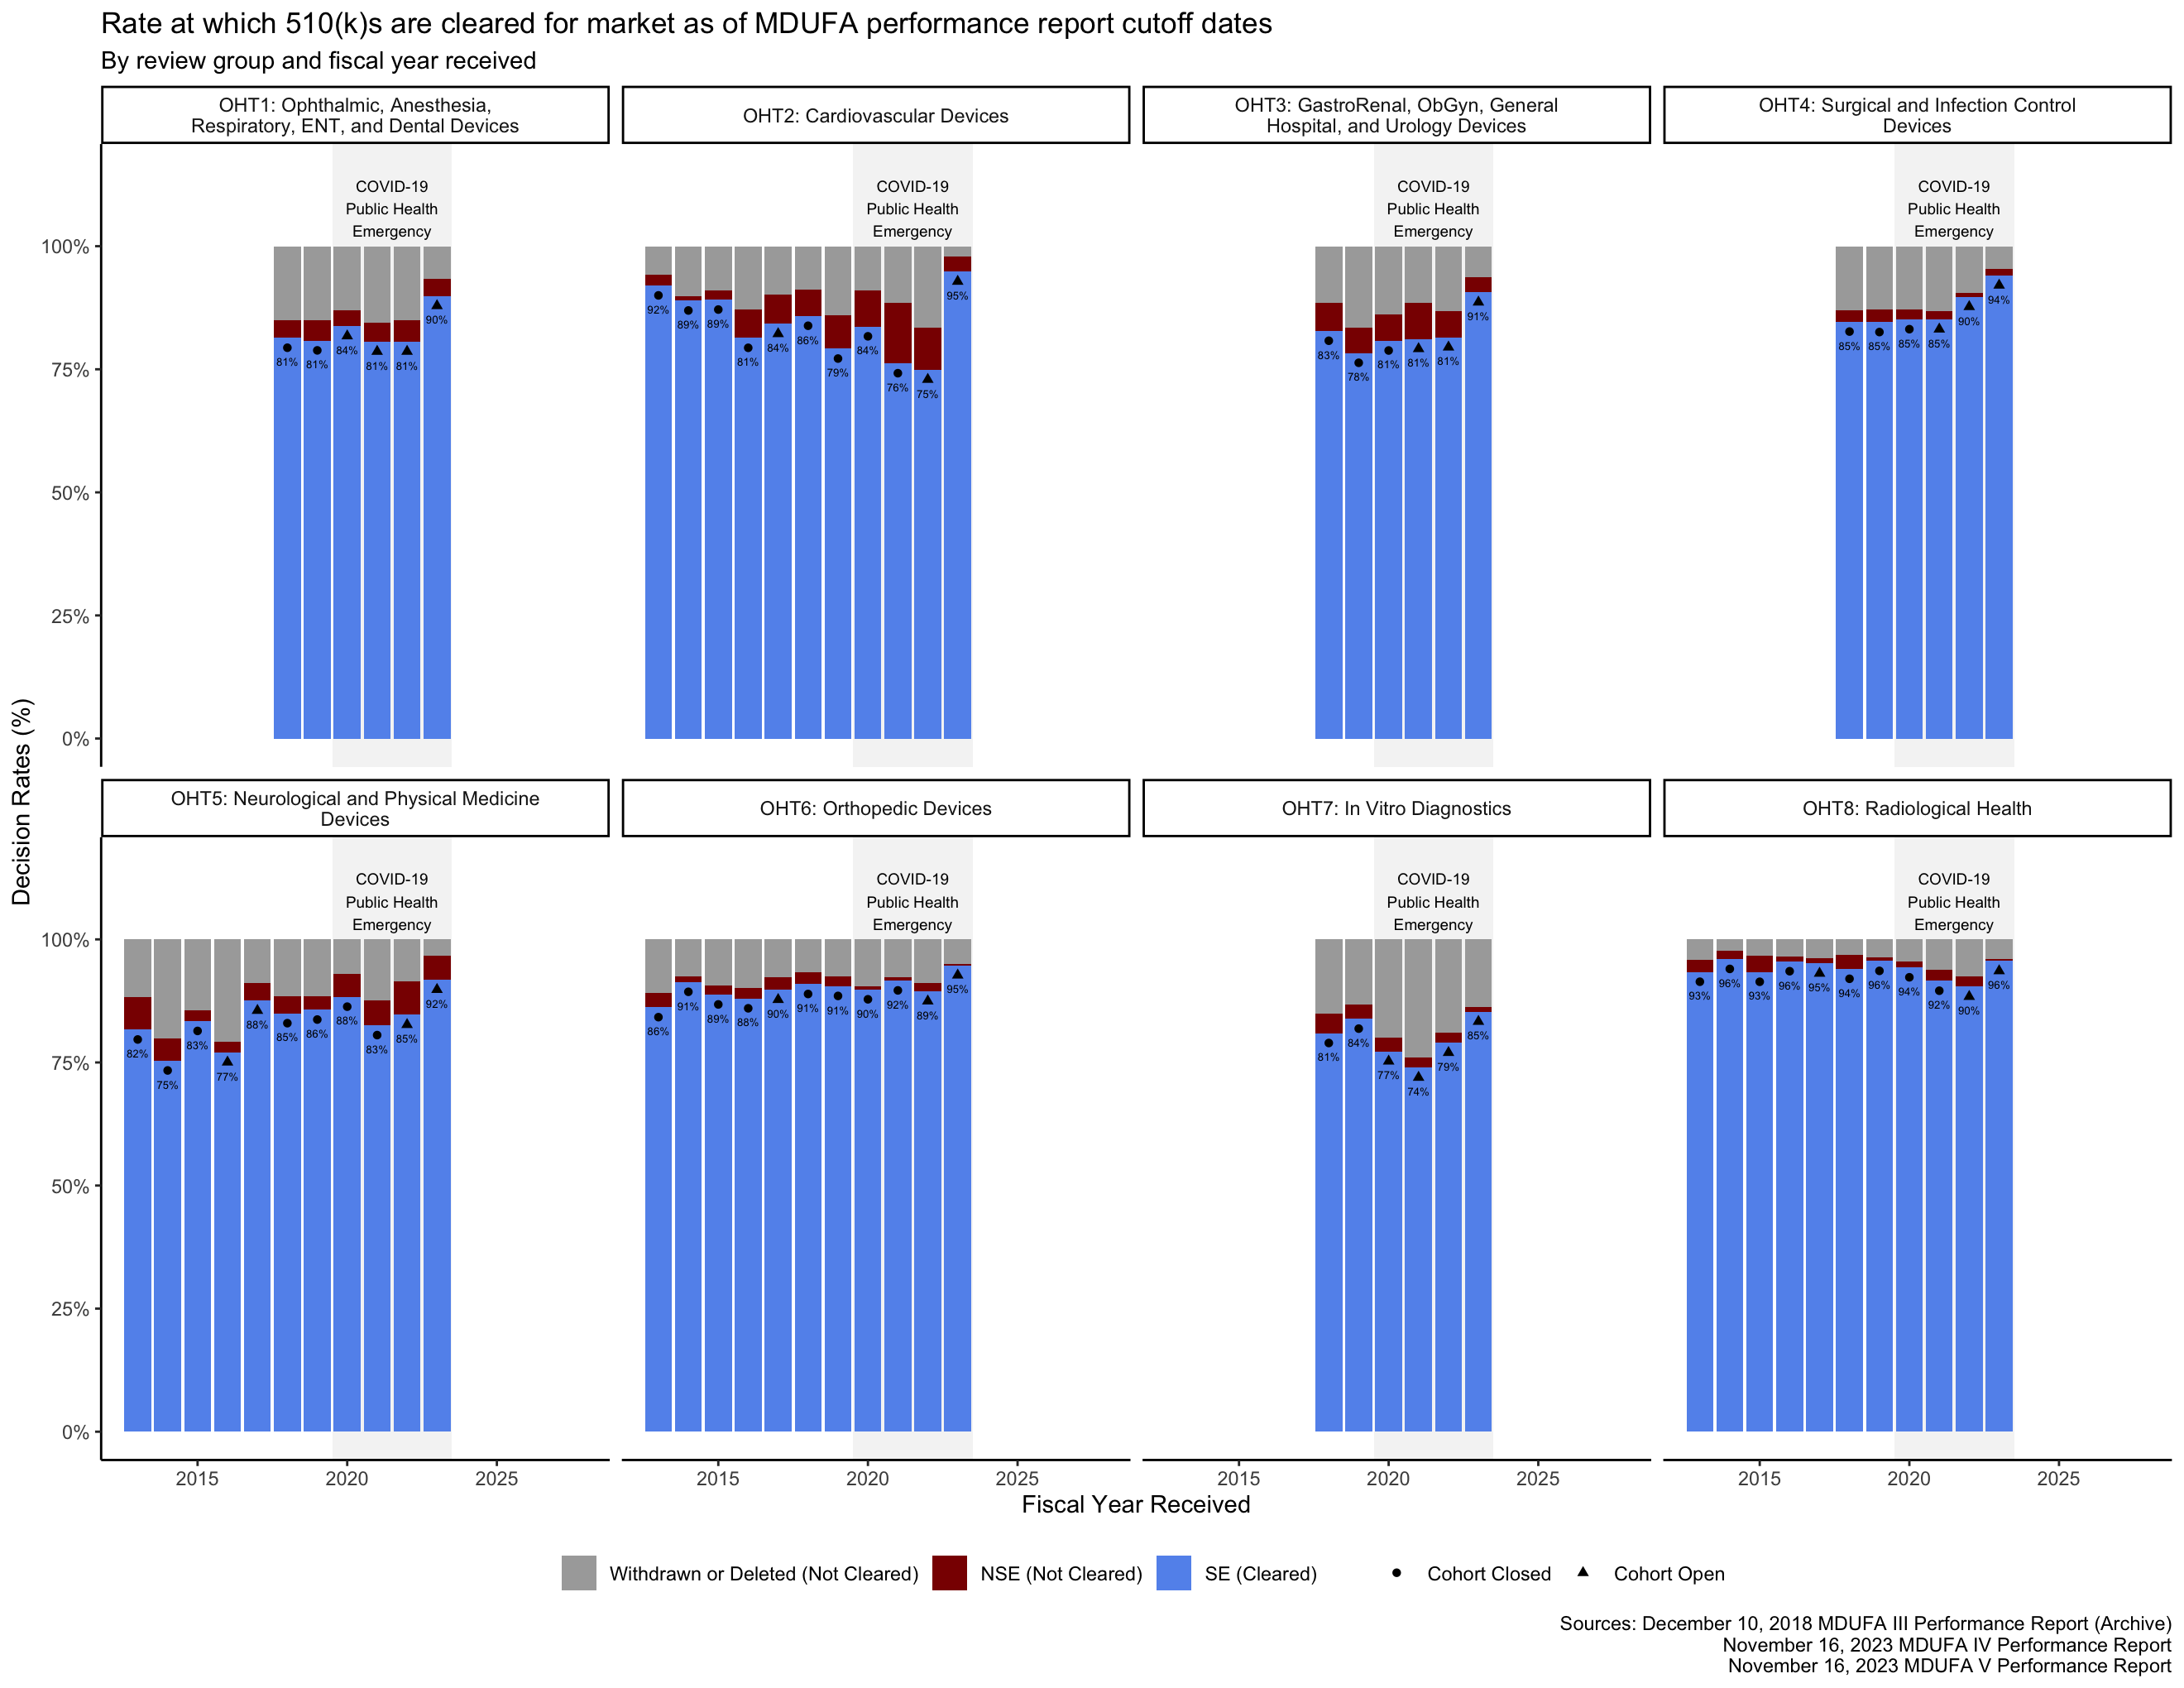
Decision metrics
In the MDUFA performance reports, the rates at which submissions receive an “SE” decision or receive an “NSE” decision are reported as percentages of submissions that receive either an SE or an NSE decision. The rates at which submissions are withdrawn by applicants or deleted by the FDA because an applicant did not respond to a request for additional information in a timely manner are reported as percentages of all accepted submissions. Because two different denominators are used to calculate these percentages in the MDUFA reports, adding the four percentages together results in a total that exceeds 100%.
This makes it difficult to understand what percentage of 510(k)s received by the FDA were cleared for market over time based on the rates in the MDUFA reports. However, the MDUFA reports also include the counts of submissions that received each of these decisions. Figure 11 shows the rates of cleared and not cleared (including withdrawn and deleted) 510(k)s for each OHT.
Closing thoughts
The objective of this work was to make the information in the MDUFA reports easier to access, analyze, and use. This post provides novel visualizations of about 1,500 values from the FDA’s 510(k) program metrics over time and across review groups. These visualizations are intended to provide a more useful view of the tabular data provided throughout the FDA’s MDUFA reports while still presenting that data dispassionately and with appropriate context.
References
Footnotes
This term is not defined in the MDUFA V Commitment Letter, but this definition is consistent with its use in other documents. [5, p. 28] [6, pp. 4, 7] [7, p. 39] While the MDUFA 3 reports are silent on the issue, the MDUFA 4 and MDUFA 5 reports confirm that “review cycle” refers to a substantive review of an “accepted” 510(k). [2, p. 257] [3, p. 238] The FDA’s approach to analyzing requests for additional information suggests that this has been the practice since FY 2013. [3, p. 103]↩︎
The FDA has used a number of analysis techniques to correct for this and get insights into recent performance based on data from open receipt cohorts. One approach is to look at historical data from when previous receipt cohorts that are now closed were still open. That information is compared to the final calculated performance metrics for the corresponding cohorts and to the receipt cohorts that are currently open to infer whether performance is better or worse now than it was then and to estimate where the final performance metric calculations for open cohorts may converge. The MDUFA reports include several figures based on this approach. [3, pp. 106–109] Best- and worst-case outcomes can also be estimated for some metrics.
These complex techniques can be difficult to interpret. I favor looking at recently closed decision cohorts instead. Metrics similar to the Total Days metrics in the MDUFA reports can be calculated for cleared 510(k) receipt and decision cohorts using the FDA’s public 510(k) database. You can access this from R using the fdadata package, and I’ve also built a free web app you can use to explore clearance timeframes using this dataset.↩︎The reorganizations had other impacts as well, but this post is focused on their implications for MDUFA performance metric data.↩︎
In addition to being a MDUFA commitment, this is in 21 USC § 360(n)(1).↩︎
See 21 CFR 807.87(m).↩︎
Reuse
Citation
@online{o'leary2024,
  author = {O’Leary, Brendan},
  title = {Downloadable Spreadsheets and Graphs of the {FDA’s} Medical
    Device Review Performance Metrics},
  date = {2024-01-03},
  url = {https://www.boleary.com/blog/mdufa/202401/},
  langid = {en},
  abstract = {The FDA publishes quarterly and annual reports that
    include performance metrics for the medical device review process.
    These reports can include thousands of performance metrics in a
    series of tables, and they are published as PDFs that regularly
    exceed three hundred pages. This post makes many of these metrics
    available for download in spreadsheets and as a data package for the
    R programming language, making the data easier to analyze and use.
    This post also provides novel visualizations of 510(k) program
    performance metrics over time and by review group.}
}